


Graph $y = 6$ using intercepts.
Answer
570k+ views
Hint: For plotting a graph we need different x values as well as their corresponding y values. Such that to solve this question we need to find the x intercept and y intercept. Also the x-intercept and y-intercept can be found by substituting y=0 and x=0 respectively. After finding these values we just need to plot them on the XY plane.
Complete step-by-step solution:
Given
$y = 6...........................\left( i \right)$
Now here we have to graph $y = 6$ using intercepts.
So here we need to find the x intercept, y intercept only rather than finding other intermediate points for plotting.
X intercept is the point where the graph touches the X axis such that \[y = 0\].
But on observing (i) we can say that the graph does not pass the X axis since there is no $x$ variable.
Such that for the function $y = 6$ we have no x intercept.
Now let’s find the y intercept:
Y intercept is the point where the graph touches the Y axis such that \[x = 0\].
Now on observing (i) we can say that for the graph $y = 6$ have the same value of $y$ for any value of $x$.
Such that even for \[x = 0\] we have $y = 6$.
\[\therefore y{\text{ intercept}} = \left( {0,6} \right)\]
Now on plotting \[y{\text{ intercept}} = \left( {0,6} \right)\]on the XY plane we get:
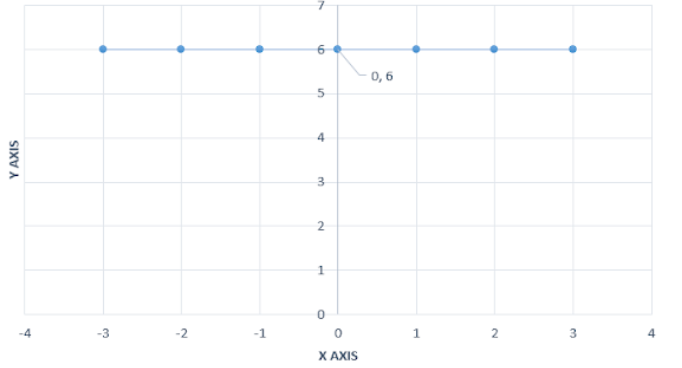
The above graph shows the plot of$y = 6$.
Note: Here, in the given question the interval refers to the time difference between the given time period. Students need to remember that while solving these questions they will just need to find the number of hours between the given time period in the question. Time difference will remain the same across all the time systems.
Complete step-by-step solution:
Given
$y = 6...........................\left( i \right)$
Now here we have to graph $y = 6$ using intercepts.
So here we need to find the x intercept, y intercept only rather than finding other intermediate points for plotting.
X intercept is the point where the graph touches the X axis such that \[y = 0\].
But on observing (i) we can say that the graph does not pass the X axis since there is no $x$ variable.
Such that for the function $y = 6$ we have no x intercept.
Now let’s find the y intercept:
Y intercept is the point where the graph touches the Y axis such that \[x = 0\].
Now on observing (i) we can say that for the graph $y = 6$ have the same value of $y$ for any value of $x$.
Such that even for \[x = 0\] we have $y = 6$.
\[\therefore y{\text{ intercept}} = \left( {0,6} \right)\]
Now on plotting \[y{\text{ intercept}} = \left( {0,6} \right)\]on the XY plane we get:
The above graph shows the plot of$y = 6$.
Note: Here, in the given question the interval refers to the time difference between the given time period. Students need to remember that while solving these questions they will just need to find the number of hours between the given time period in the question. Time difference will remain the same across all the time systems.
Recently Updated Pages
Master Class 10 English: Engaging Questions & Answers for Success
Master Class 10 Social Science: Engaging Questions & Answers for Success
Master Class 10 Computer Science: Engaging Questions & Answers for Success
Class 10 Question and Answer - Your Ultimate Solutions Guide
Master Class 10 General Knowledge: Engaging Questions & Answers for Success
Master Class 10 Maths: Engaging Questions & Answers for Success
Trending doubts
What is the full form of NDA a National Democratic class 10 social science CBSE
Explain the Treaty of Vienna of 1815 class 10 social science CBSE
Who Won 36 Oscar Awards? Record Holder Revealed
Bharatiya Janata Party was founded in the year A 1979 class 10 social science CBSE
What is the median of the first 10 natural numbers class 10 maths CBSE
Why is it 530 pm in india when it is 1200 afternoon class 10 social science CBSE