


How do you graph $ y = - 6 + 2x $ using the intercepts?
Answer
558.9k+ views
Hint: As we can see that we have an equation and it is a linear equation in two variables. We need to plot a graph for the given equation, For plotting a graph we need different $ x $ value as well as $ y $ value. So we need to find the values by substituting $ y = 0 $ and $ x = 0 $ respectively, after these we need to plot these on the graph.
Complete step by step solution:
According to the question we have the equation $ y = - 6 + 2x $ .
We will first determine the $ x $ intercept by putting $ y = 0 $ , So we have $ 0 = 2x - 6 $ .
By adding both the sides by $ 6 $ we have,
$ 0 + 6 = 2x - 6 + 6 \Rightarrow 6 = 2x $ , So we have the value of $ x = \dfrac{6}{2} = 3 $ .
So we have the $ x $ intercept $ (x,y) = (3,0) $ .
Now we will determine the $ y - $ intercept, this time we substitute the value $ = 0 $ , so we have $ y = 2(0) - 6 \Rightarrow y = - 6 $ . Hence the $ y - $ intercept is $ (x,y) = (0, - 6) $ .
Now we will put them into graph:
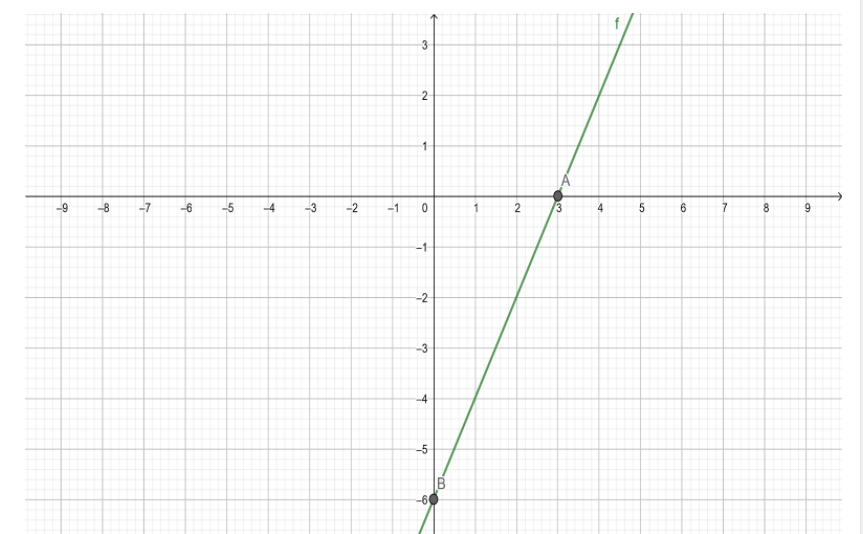
Hence in the above figure we have point A $ (3,0) $ and point B $ (0, - 6) $ .
Note: Before solving this kind of question we should be aware of the $ x $ and $ y $ axis and how to plot their values. The calculations should be done carefully to avoid calculation mistakes because it will create a wrong graph. We should note that the above equation is a linear equation so the graph is always a straight line.
Complete step by step solution:
According to the question we have the equation $ y = - 6 + 2x $ .
We will first determine the $ x $ intercept by putting $ y = 0 $ , So we have $ 0 = 2x - 6 $ .
By adding both the sides by $ 6 $ we have,
$ 0 + 6 = 2x - 6 + 6 \Rightarrow 6 = 2x $ , So we have the value of $ x = \dfrac{6}{2} = 3 $ .
So we have the $ x $ intercept $ (x,y) = (3,0) $ .
Now we will determine the $ y - $ intercept, this time we substitute the value $ = 0 $ , so we have $ y = 2(0) - 6 \Rightarrow y = - 6 $ . Hence the $ y - $ intercept is $ (x,y) = (0, - 6) $ .
Now we will put them into graph:
Hence in the above figure we have point A $ (3,0) $ and point B $ (0, - 6) $ .
Note: Before solving this kind of question we should be aware of the $ x $ and $ y $ axis and how to plot their values. The calculations should be done carefully to avoid calculation mistakes because it will create a wrong graph. We should note that the above equation is a linear equation so the graph is always a straight line.
Recently Updated Pages
Master Class 11 Social Science: Engaging Questions & Answers for Success
Master Class 11 English: Engaging Questions & Answers for Success
Master Class 11 Maths: Engaging Questions & Answers for Success
Master Class 11 Chemistry: Engaging Questions & Answers for Success
Master Class 11 Biology: Engaging Questions & Answers for Success
Class 11 Question and Answer - Your Ultimate Solutions Guide
Trending doubts
One Metric ton is equal to kg A 10000 B 1000 C 100 class 11 physics CBSE
Difference Between Prokaryotic Cells and Eukaryotic Cells
Find the value of the expression given below sin 30circ class 11 maths CBSE
1 ton equals to A 100 kg B 1000 kg C 10 kg D 10000 class 11 physics CBSE
Two of the body parts which do not appear in MRI are class 11 biology CBSE
Draw a diagram of nephron and explain its structur class 11 biology CBSE