


How do you graph y – 5x = - 2 using a table of values.
Answer
595.2k+ views
Hint: We are given with a linear equation in two variables. Now first we will rearrange the equation in the form y = ax + b. Now we will substitute different values of x and find corresponding different values of y. Hence we get the solutions (x, y) for the given equation. Now we will plot the point (x, y) on a graph and draw a line passing through the points. Hence we have the graph of the equation.
Complete step-by-step solution:
Now let us consider the given equation y – 5x = -2.
Transposing the term 5x to RHS we get, y = 5x – 2.
To find the table of values we will find the pairs of solutions of the equation.
Now we will substitute different values of x and find corresponding values of y.
Now let us first put x = 0 then we get, y = 5(0) – 2 Hence y = - 2.
Now let us substitute x = 1 then we get y = 5(1) – 2 Hence y = 3.
Similarly by substituting x = 2 we get y = 5(2) – 2 Hence y = 8.
Now we have the following pair of solutions.
Now we will plot the points (0, -2), (1, 3) and (2, 8) on the graph. Once we have these points we will draw a line passing through all these points. Hence we have the graph of the equation
y – 5x = -2.
Hence we have the graph of the given equation.
Note: Note that only one line can be passed through two given points and to define a line minimum two points are needed. Hence we should take at least two different set of solutions while plotting the graph.
Complete step-by-step solution:
Now let us consider the given equation y – 5x = -2.
Transposing the term 5x to RHS we get, y = 5x – 2.
To find the table of values we will find the pairs of solutions of the equation.
Now we will substitute different values of x and find corresponding values of y.
Now let us first put x = 0 then we get, y = 5(0) – 2 Hence y = - 2.
Now let us substitute x = 1 then we get y = 5(1) – 2 Hence y = 3.
Similarly by substituting x = 2 we get y = 5(2) – 2 Hence y = 8.
Now we have the following pair of solutions.
| x | y |
| 0 | -2 |
| 1 | 3 |
| 2 | 8 |
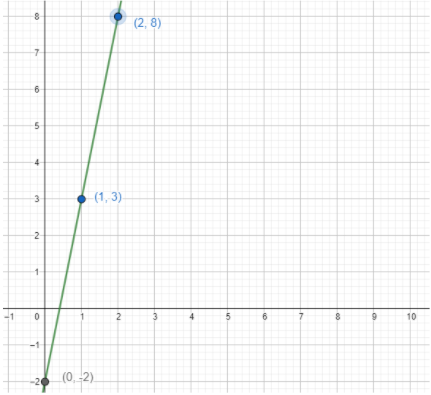
Now we will plot the points (0, -2), (1, 3) and (2, 8) on the graph. Once we have these points we will draw a line passing through all these points. Hence we have the graph of the equation
y – 5x = -2.
Hence we have the graph of the given equation.
Note: Note that only one line can be passed through two given points and to define a line minimum two points are needed. Hence we should take at least two different set of solutions while plotting the graph.
Recently Updated Pages
Master Class 11 English: Engaging Questions & Answers for Success
Master Class 11 Social Science: Engaging Questions & Answers for Success
Master Class 11 Maths: Engaging Questions & Answers for Success
Master Class 11 Biology: Engaging Questions & Answers for Success
Master Class 11 Physics: Engaging Questions & Answers for Success
Master Class 11 Chemistry: Engaging Questions & Answers for Success
Trending doubts
Explain the Treaty of Vienna of 1815 class 10 social science CBSE
What is the Total Duration of Football Match?
First Cotton Mill of India
In which year voting age was reduced from 21 to 18?
10 examples of evaporation in daily life with explanations
What planets have no moons Which one has only one moon class 10 physics CBSE