


How do you graph \[y - 5x = 0\] by plotting points?
Answer
588.6k+ views
Hint: We use the given equation of line. Substitute the value of ‘x’ and calculate the corresponding value of ‘y’ from the equation. Similarly, we can substitute values for ‘y’ and calculate the corresponding values for ‘x’ using the equation.
Complete Step by Step Solution:
We have equation of line \[y - 5x = 0\] … (1)
We can shift 5x to the right hand side of the equation and change the sign of the value when shifting it from one side of the equation to another.
\[ \Rightarrow y = 5x\] … (2)
We will substitute the value of ‘x’ in the right hand side of equation (2) and calculate the corresponding value of ‘y’.
Put \[x = 0\], then \[y = 5 \times 0 = 0\]
Point becomes \[(0,0)\]
Now, if we put \[x = 1\], then \[y = 5 \times 1 = 5\]
Point becomes \[(1,5)\]
Now, if we put \[x = 2\], then \[y = 5 \times 2 = 10\]
Point becomes \[(2,10)\]
Now we plot the points \[(0,0)\], \[(1,5)\]and \[(2,10)\] on the graph.
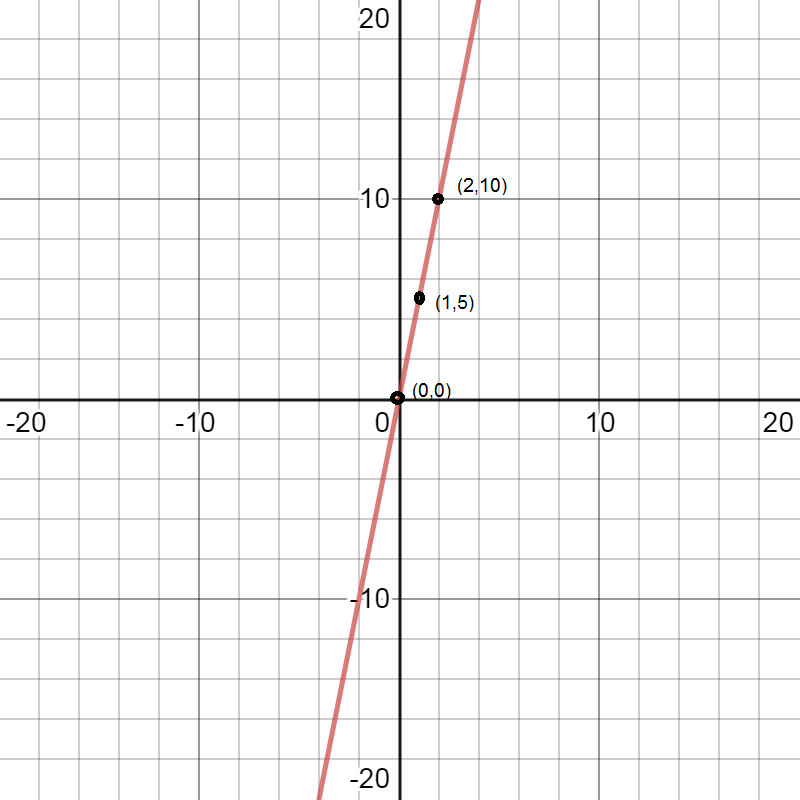
\[\therefore \]The graph of the equation \[y - 5x = 0\] can be made by plotting the points \[(0,0)\], \[(1,5)\]and \[(2,10)\]and joining the line through these three points.

Note:
Students are likely to make mistakes while shifting the values from one side of the equation to another side of the equation as they forget to change the sign of the value shifted. Keep in mind we always change the sign of the value from positive to negative and vice versa when shifting values from one side of the equation to another side of the equation. When plotting the points on the graph many students tend to mark wrong points due to the scale, keep in mind we can adjust the scale of the graph according to our need.
Complete Step by Step Solution:
We have equation of line \[y - 5x = 0\] … (1)
We can shift 5x to the right hand side of the equation and change the sign of the value when shifting it from one side of the equation to another.
\[ \Rightarrow y = 5x\] … (2)
We will substitute the value of ‘x’ in the right hand side of equation (2) and calculate the corresponding value of ‘y’.
Put \[x = 0\], then \[y = 5 \times 0 = 0\]
Point becomes \[(0,0)\]
Now, if we put \[x = 1\], then \[y = 5 \times 1 = 5\]
Point becomes \[(1,5)\]
Now, if we put \[x = 2\], then \[y = 5 \times 2 = 10\]
Point becomes \[(2,10)\]
Now we plot the points \[(0,0)\], \[(1,5)\]and \[(2,10)\] on the graph.
\[\therefore \]The graph of the equation \[y - 5x = 0\] can be made by plotting the points \[(0,0)\], \[(1,5)\]and \[(2,10)\]and joining the line through these three points.
Note:
Students are likely to make mistakes while shifting the values from one side of the equation to another side of the equation as they forget to change the sign of the value shifted. Keep in mind we always change the sign of the value from positive to negative and vice versa when shifting values from one side of the equation to another side of the equation. When plotting the points on the graph many students tend to mark wrong points due to the scale, keep in mind we can adjust the scale of the graph according to our need.
Recently Updated Pages
Master Class 11 English: Engaging Questions & Answers for Success
Master Class 11 Social Science: Engaging Questions & Answers for Success
Master Class 11 Maths: Engaging Questions & Answers for Success
Master Class 11 Biology: Engaging Questions & Answers for Success
Master Class 11 Physics: Engaging Questions & Answers for Success
Master Class 11 Chemistry: Engaging Questions & Answers for Success
Trending doubts
One Metric ton is equal to kg A 10000 B 1000 C 100 class 11 physics CBSE
Difference Between Prokaryotic Cells and Eukaryotic Cells
Find the value of the expression given below sin 30circ class 11 maths CBSE
Difference between physical and chemical change class 11 chemistry CBSE
Two of the body parts which do not appear in MRI are class 11 biology CBSE
Draw a diagram of a plant cell and label at least eight class 11 biology CBSE