


How do you graph $ y = - 5x + 10 $ using intercepts?
Answer
577.2k+ views
Hint: We have to graph the given equation by using the intercepts. The x-intercept is that point on the x-axis at which the given equation cuts the x-axis, so at x-intercept y is 0. The y-intercept is that point on the y-axis at which the given line cuts the y-axis, so at y-intercept x is 0. So we put the value of both x and y zero one by one and then find the value of other variables from the equation of the line. We can obtain the line on the graph by joining these points.
Complete step-by-step answer:
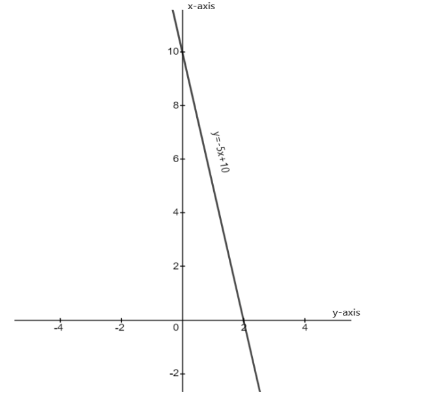
The equation of the line is $ y = - 5x + 10 $
When $ x = 0 $
$
y = - 5(0) + 10 \\
\Rightarrow y = 10 \;
$
The line cuts the y-axis at the point $ (0,10) $
When $ y = 0 $
$
0 = - 5x + 10 \\
\Rightarrow 5x = 10 \\
\Rightarrow x = 2 \;
$
The line cuts the x-axis at the point $ (2,0) $
We can trace the line of the equation $ y = - 5x + 10 $ by joining these two points and then extending the obtained line away in the opposite directions.
Note: A graph shows the relation between two variable quantities, it contains two axes perpendicular to each other namely the x-axis and the y-axis. Each variable is measured along one of the axes. In the question, we are given one linear equation containing two variables namely x and y, x is measured along the x-axis and y is measured along the y-axis while tracing the given equations. To find the equation of a line, we must know the coordinates of at least two of the points lying on the line. We are given the equation of a line in the question so we had to find the coordinates using the given equation.
Complete step-by-step answer:
The equation of the line is $ y = - 5x + 10 $
When $ x = 0 $
$
y = - 5(0) + 10 \\
\Rightarrow y = 10 \;
$
The line cuts the y-axis at the point $ (0,10) $
When $ y = 0 $
$
0 = - 5x + 10 \\
\Rightarrow 5x = 10 \\
\Rightarrow x = 2 \;
$
The line cuts the x-axis at the point $ (2,0) $
We can trace the line of the equation $ y = - 5x + 10 $ by joining these two points and then extending the obtained line away in the opposite directions.
Note: A graph shows the relation between two variable quantities, it contains two axes perpendicular to each other namely the x-axis and the y-axis. Each variable is measured along one of the axes. In the question, we are given one linear equation containing two variables namely x and y, x is measured along the x-axis and y is measured along the y-axis while tracing the given equations. To find the equation of a line, we must know the coordinates of at least two of the points lying on the line. We are given the equation of a line in the question so we had to find the coordinates using the given equation.
Recently Updated Pages
Master Class 8 English: Engaging Questions & Answers for Success
Master Class 8 Science: Engaging Questions & Answers for Success
Master Class 8 Maths: Engaging Questions & Answers for Success
Class 8 Question and Answer - Your Ultimate Solutions Guide
Master Class 8 Social Science: Engaging Questions & Answers for Success
Master Class 12 Economics: Engaging Questions & Answers for Success
Trending doubts
What is BLO What is the full form of BLO class 8 social science CBSE
Citizens of India can vote at the age of A 18 years class 8 social science CBSE
Right to vote is a AFundamental Right BFundamental class 8 social science CBSE
Give me the opposite gender of Duck class 8 english CBSE
Full form of STD, ISD and PCO
Explain land use pattern in India and why has the land class 8 social science CBSE