


How do you graph \[y = 4x - 3\] by plotting points?
Answer
587.7k+ views
Hint: Given equation \[y = 4x - 3\].
As we know that the slope intercept form is y=mx+c, where y= y coordinate, x= x coordinate, m=slope, c=y intercept. Now we will take random values of x to get values of y, and then we will plot it in a graph in the form of coordinates that is (x, y).
Complete step by step solution:
By comparing the given equation with the standard equation form that is \[y = mx + c\], we get slope \[\left( m \right) = 4\] where + sign indicates the increasing nature of slope. Now, for random values of x, we find value of y
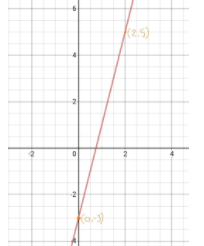
So, when \[x = 2\], putting this value of \[x\] in the original equation we get \[y{\text{ }}as{\text{ }}y = 4 \times 2 - 3 = 5\].
So, our first coordinate is \[\left( {2,5} \right)\]
Now, when \[x = 0\] , we get \[y{\text{ }}as{\text{ }}y = 4 \times 0 - 3 = - 3\]
The second coordinate is \[\left( {0, - 3} \right)\]
Now, we will plot both coordinates in the x-y plane and join both of these coordinates to get our required graph. As we can see that point \[\left( {2,5} \right)\] lies on 1st quadrant and point \[\left( {0, - 3} \right)\] lies on y-axis, so when we join we get a graph of increasing slope.
Note:
We can cross-check our graph by observing our slope. For the given question our slope is positive, so the graph must be of increasing nature. For plotting the graph our coordinates must be real numbers otherwise we are unable to plot it in the x-y plane. As it is a linear equation so it will get a straight line and also it contains an intercept so it must not pass through the origin.it must cut the negative y-axis and positive x-axis because it has some y-intercept. we can assume a rough idea of the graph by just observing the equation and also crosscheck them.
As we know that the slope intercept form is y=mx+c, where y= y coordinate, x= x coordinate, m=slope, c=y intercept. Now we will take random values of x to get values of y, and then we will plot it in a graph in the form of coordinates that is (x, y).
Complete step by step solution:
By comparing the given equation with the standard equation form that is \[y = mx + c\], we get slope \[\left( m \right) = 4\] where + sign indicates the increasing nature of slope. Now, for random values of x, we find value of y
So, when \[x = 2\], putting this value of \[x\] in the original equation we get \[y{\text{ }}as{\text{ }}y = 4 \times 2 - 3 = 5\].
So, our first coordinate is \[\left( {2,5} \right)\]
Now, when \[x = 0\] , we get \[y{\text{ }}as{\text{ }}y = 4 \times 0 - 3 = - 3\]
The second coordinate is \[\left( {0, - 3} \right)\]
Now, we will plot both coordinates in the x-y plane and join both of these coordinates to get our required graph. As we can see that point \[\left( {2,5} \right)\] lies on 1st quadrant and point \[\left( {0, - 3} \right)\] lies on y-axis, so when we join we get a graph of increasing slope.
Note:
We can cross-check our graph by observing our slope. For the given question our slope is positive, so the graph must be of increasing nature. For plotting the graph our coordinates must be real numbers otherwise we are unable to plot it in the x-y plane. As it is a linear equation so it will get a straight line and also it contains an intercept so it must not pass through the origin.it must cut the negative y-axis and positive x-axis because it has some y-intercept. we can assume a rough idea of the graph by just observing the equation and also crosscheck them.
Recently Updated Pages
Master Class 9 General Knowledge: Engaging Questions & Answers for Success
Master Class 9 Maths: Engaging Questions & Answers for Success
Master Class 9 Science: Engaging Questions & Answers for Success
Master Class 9 English: Engaging Questions & Answers for Success
Master Class 9 Social Science: Engaging Questions & Answers for Success
Class 9 Question and Answer - Your Ultimate Solutions Guide
Trending doubts
One Metric ton is equal to kg A 10000 B 1000 C 100 class 11 physics CBSE
Difference Between Prokaryotic Cells and Eukaryotic Cells
Two of the body parts which do not appear in MRI are class 11 biology CBSE
1 ton equals to A 100 kg B 1000 kg C 10 kg D 10000 class 11 physics CBSE
10 examples of friction in our daily life
Name the Largest and the Smallest Cell in the Human Body ?