


How do you graph \[y = - 3x + 3\] using a table?
Answer
562.5k+ views
Hint: We need to draw the graph ‘x’ versus ‘y’. Normally we give the random values for ‘x’ and we find the value of ‘y’. If we give all the real number values of ‘x’ we will get a decimal point of ‘y’ which is difficult to point out the coordinate in the graph. So we give all the real values for ‘y’ and we find the ‘x’ values. Thus we will have coordinate points (x, y). Hence, we can plot the graph by using the values. We can also draw the graph using the intercept method. But here we have a function which is passing through origin. So we use tables to draw the graph.
Complete step-by-step solution:
Given \[y = - 3x + 3\].
Let's give the values for ‘x’ and we find the value of ‘y’.
Put \[x = 1\]in \[y = - 3x + 3\] we have,
\[
\Rightarrow y = - 3x + 3 \\
\Rightarrow y = - 3\left( 1 \right) + 3 \\
\Rightarrow y = - 3 + 3 \\
\Rightarrow y = 0 \\
\]
Thus we have coordinate point \[(1,0)\].
Put \[x = - 1\]in \[y = - 3x + 3\] we have,
\[
\Rightarrow y = - 3x + 3 \\
\Rightarrow y = - 3\left( { - 1} \right) + 3 \\
\Rightarrow y = 3 + 3 \\
\Rightarrow y = 6 \\
\]
Thus we have coordinate points \[( - 1,6)\].
Put \[x = 2\]in \[y = - 3x + 3\] we have,
\[
\Rightarrow y = - 3x + 3 \\
\Rightarrow y = - 3\left( 2 \right) + 3 \\
\Rightarrow y = - 6 + 3 \\
\Rightarrow y = - 3 \\
\]
Thus we have coordinate points \[(2, - 3)\].
Put \[x = - 2\]in \[y = - 3x + 3\] we have,
\[
\Rightarrow y = - 3x + 3 \\
\Rightarrow y = - 3\left( { - 2} \right) + 3 \\
\Rightarrow y = 6 + 3 \\
\Rightarrow y = 9 \\
\]
Thus we have coordinate point \[( - 2,9)\].
Let’s draw the graph for these coordinates,
Here we take x-axis = 1 unit
y-axis = 1 unit =1 unit.
Note: We can see that the given curve is parabola. A graph shows the relation between two variable quantities, it contains two axes perpendicular to each other namely the x-axis and the y-axis. Each variable is measured along one of the axes. In the question, we are given one linear equation containing two variables namely x and y, x is measured along the x-axis and y is measured along the y-axis while tracing the given equations.
Complete step-by-step solution:
Given \[y = - 3x + 3\].
Let's give the values for ‘x’ and we find the value of ‘y’.
Put \[x = 1\]in \[y = - 3x + 3\] we have,
\[
\Rightarrow y = - 3x + 3 \\
\Rightarrow y = - 3\left( 1 \right) + 3 \\
\Rightarrow y = - 3 + 3 \\
\Rightarrow y = 0 \\
\]
Thus we have coordinate point \[(1,0)\].
Put \[x = - 1\]in \[y = - 3x + 3\] we have,
\[
\Rightarrow y = - 3x + 3 \\
\Rightarrow y = - 3\left( { - 1} \right) + 3 \\
\Rightarrow y = 3 + 3 \\
\Rightarrow y = 6 \\
\]
Thus we have coordinate points \[( - 1,6)\].
Put \[x = 2\]in \[y = - 3x + 3\] we have,
\[
\Rightarrow y = - 3x + 3 \\
\Rightarrow y = - 3\left( 2 \right) + 3 \\
\Rightarrow y = - 6 + 3 \\
\Rightarrow y = - 3 \\
\]
Thus we have coordinate points \[(2, - 3)\].
Put \[x = - 2\]in \[y = - 3x + 3\] we have,
\[
\Rightarrow y = - 3x + 3 \\
\Rightarrow y = - 3\left( { - 2} \right) + 3 \\
\Rightarrow y = 6 + 3 \\
\Rightarrow y = 9 \\
\]
Thus we have coordinate point \[( - 2,9)\].
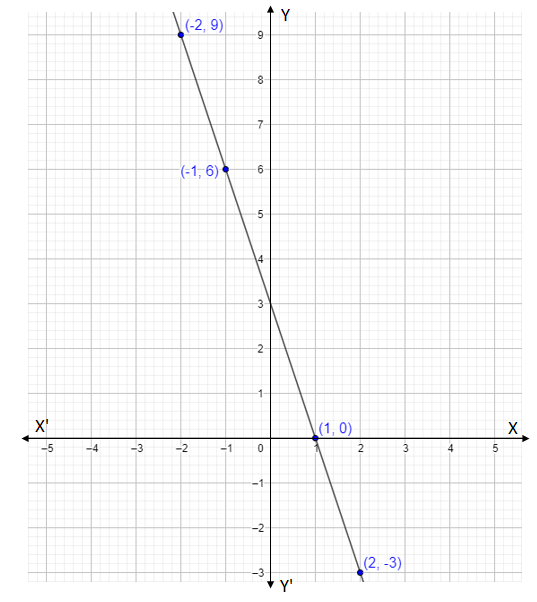
| \[x\] | \[1\] | \[ - 1\] | \[2\] | \[ - 2\] |
| \[y\] | \[0\] | \[6\] | \[ - 3\] | \[9\] |
Let’s draw the graph for these coordinates,
Here we take x-axis = 1 unit
y-axis = 1 unit =1 unit.
Note: We can see that the given curve is parabola. A graph shows the relation between two variable quantities, it contains two axes perpendicular to each other namely the x-axis and the y-axis. Each variable is measured along one of the axes. In the question, we are given one linear equation containing two variables namely x and y, x is measured along the x-axis and y is measured along the y-axis while tracing the given equations.
Recently Updated Pages
Master Class 10 English: Engaging Questions & Answers for Success
Master Class 10 Social Science: Engaging Questions & Answers for Success
Master Class 10 Computer Science: Engaging Questions & Answers for Success
Class 10 Question and Answer - Your Ultimate Solutions Guide
Master Class 10 General Knowledge: Engaging Questions & Answers for Success
Master Class 10 Maths: Engaging Questions & Answers for Success
Trending doubts
Explain the Treaty of Vienna of 1815 class 10 social science CBSE
Who Won 36 Oscar Awards? Record Holder Revealed
What is the median of the first 10 natural numbers class 10 maths CBSE
Why is it 530 pm in india when it is 1200 afternoon class 10 social science CBSE
Define Potential, Developed, Stock and Reserved resources
Fill the blanks with proper collective nouns 1 A of class 10 english CBSE