


How do you graph \[y = 3{\left( {x + 3} \right)^2} - 3\] ?
Answer
531.9k+ views
Hint: Here in this question, we have to plot a graph for the given equation. The given equation resembles or recognised as the standard equation for a parabola, which is \[f\left( x \right) = a{\left( {x - h} \right)^2} + k\] , where \[\left( {h,k} \right)\] is the vertex of the parabola and next find the focus, directrix and the points to plot the required graph.
Complete step-by-step answer:
We know, in the quadratic equation \[f\left( x \right) = a{x^2} + bx + c\] , a b and c are the constants and \[x\] is the variable. So, by finding the different values of \[x\] and corresponding values of \[y\] or \[f\left( x \right)\] , we can plot all the points in the graph and by joining all of them we can get the required shape.
here Parabola Formula for the equation of a parabola given in its standard form \[f\left( x \right) = a{x^2} + bx + c\] is:
Vertex of Parabola = \[\left( {\dfrac{{ - b}}{{2a}},\dfrac{{4ac - {b^2}}}{{4a}}} \right)\]
Focus of the parabola = \[\left( {\dfrac{{ - b}}{{2a}},\dfrac{{4ac - {b^2} + 1}}{{4a}}} \right)\]
Directrix of parabola \[y = \dfrac{{4ac - {b^2} - 1}}{{4a}}\]
Now Consider, the given equation
\[ \Rightarrow \,y = 3{\left( {x + 3} \right)^2} - 3\]
On expanding \[{\left( {x + 3} \right)^2}\] using identities \[{\left( {a + b} \right)^2} = {a^2} + {b^2} + 2ab\]
\[ \Rightarrow \,y = 3\left( {{x^2} + {3^2} + 2\left( x \right)\left( 3 \right)} \right) - 3\]
\[ \Rightarrow \,y = 3\left( {{x^2} + 9 + 6x} \right) - 3\]
\[ \Rightarrow \,y = 3{x^2} + 27 + 18x - 3\]
On simplification, we get
\[ \Rightarrow \,y = 3{x^2} + 18x + 24\]
Where, \[a = 3\] , \[b = 18\] and \[c = 24\]
Vertex of Parabola = \[\left( {\dfrac{{ - b}}{{2a}},\dfrac{{4ac - {b^2}}}{{4a}}} \right)\]
\[ \Rightarrow \,\,\left( {\dfrac{{ - 18}}{{2\left( 3 \right)}},\dfrac{{4\left( 3 \right)\left( {24} \right) - {{\left( {18} \right)}^2}}}{{4\left( 3 \right)}}} \right)\]
\[ \Rightarrow \,\,\left( {\dfrac{{ - 18}}{6},\dfrac{{288 - 324}}{{12}}} \right)\]
\[ \Rightarrow \,\,\left( { - 3, - 3} \right)\]
Vertex = \[\left( { - 3, - 3} \right)\]
Focus of the parabola = \[\left( {\dfrac{{ - b}}{{2a}},\dfrac{{4ac - {b^2} + 1}}{{4a}}} \right)\]
\[ \Rightarrow \,\,\left( {\dfrac{{ - 18}}{{2\left( 3 \right)}},\dfrac{{4\left( 3 \right)\left( {24} \right) - {{\left( {18} \right)}^2} + 1}}{{4\left( 3 \right)}}} \right)\]
\[ \Rightarrow \,\,\left( {\dfrac{{ - 18}}{6},\dfrac{{288 - 324 + 1}}{{12}}} \right)\]
\[ \Rightarrow \,\,\left( {\dfrac{{ - 18}}{6},\dfrac{{ - 36 + 1}}{{12}}} \right)\]
\[ \Rightarrow \,\,\left( {\dfrac{{ - 18}}{6},\dfrac{{ - 35}}{{12}}} \right)\]
Focus = \[\left( {\dfrac{{ - 18}}{6},\dfrac{{ - 35}}{{12}}} \right)\]
Directrix of parabola \[y = \dfrac{{4ac - {b^2} - 1}}{{4a}}\]
\[ \Rightarrow \,\,\dfrac{{4\left( 3 \right)\left( {24} \right) - {{\left( {18} \right)}^2} - 1}}{{4\left( 3 \right)}}\]
\[ \Rightarrow \,\,\dfrac{{288 - 324 - 1}}{{12}}\]
\[ \Rightarrow \,\,\dfrac{{ - 36 - 1}}{{12}}\]
\[ \Rightarrow \,\,\dfrac{{ - 37}}{{12}}\]
Directrix \[y = \dfrac{{ - 37}}{{12}}\]
Now putting in different values for x in the equation \[y = 3{\left( {x + 3} \right)^2} - 3\] and calculate the corresponding values for y.
When \[x = - 5 \Rightarrow y = 3{\left( { - 5 + 3} \right)^2} - 3 \Rightarrow y = 9\]
When \[x = - 4 \Rightarrow y = 3{\left( { - 4 + 3} \right)^2} - 3 \Rightarrow y = 0\]
When \[x = - 3 \Rightarrow y = 3{\left( { - 3 + 3} \right)^2} - 3 \Rightarrow y = - 3\]
When \[x = - 2 \Rightarrow y = 3{\left( { - 2 + 3} \right)^2} - 3 \Rightarrow y = 0\]
When \[x = - 1 \Rightarrow y = 3{\left( { - 1 + 3} \right)^2} - 3 \Rightarrow y = 9\]
Now, plot the required graph:
we determine the values and finally we obtain the linear equation for y and hence we can plot the graph.
Note: The plotting of a graph is different here. When we plot the graph for the parabola we use different methods. Here in this question Vertex of Parabola = \[\left( {\dfrac{{ - b}}{{2a}},\dfrac{{4ac - {b^2}}}{{4a}}} \right)\] , Focus of the parabola = \[\left( {\dfrac{{ - b}}{{2a}},\dfrac{{4ac - {b^2} + 1}}{{4a}}} \right)\] , Directrix of parabola \[y = \dfrac{{4ac - {b^2} - 1}}{{4a}}\]
Complete step-by-step answer:
We know, in the quadratic equation \[f\left( x \right) = a{x^2} + bx + c\] , a b and c are the constants and \[x\] is the variable. So, by finding the different values of \[x\] and corresponding values of \[y\] or \[f\left( x \right)\] , we can plot all the points in the graph and by joining all of them we can get the required shape.
here Parabola Formula for the equation of a parabola given in its standard form \[f\left( x \right) = a{x^2} + bx + c\] is:
Vertex of Parabola = \[\left( {\dfrac{{ - b}}{{2a}},\dfrac{{4ac - {b^2}}}{{4a}}} \right)\]
Focus of the parabola = \[\left( {\dfrac{{ - b}}{{2a}},\dfrac{{4ac - {b^2} + 1}}{{4a}}} \right)\]
Directrix of parabola \[y = \dfrac{{4ac - {b^2} - 1}}{{4a}}\]
Now Consider, the given equation
\[ \Rightarrow \,y = 3{\left( {x + 3} \right)^2} - 3\]
On expanding \[{\left( {x + 3} \right)^2}\] using identities \[{\left( {a + b} \right)^2} = {a^2} + {b^2} + 2ab\]
\[ \Rightarrow \,y = 3\left( {{x^2} + {3^2} + 2\left( x \right)\left( 3 \right)} \right) - 3\]
\[ \Rightarrow \,y = 3\left( {{x^2} + 9 + 6x} \right) - 3\]
\[ \Rightarrow \,y = 3{x^2} + 27 + 18x - 3\]
On simplification, we get
\[ \Rightarrow \,y = 3{x^2} + 18x + 24\]
Where, \[a = 3\] , \[b = 18\] and \[c = 24\]
Vertex of Parabola = \[\left( {\dfrac{{ - b}}{{2a}},\dfrac{{4ac - {b^2}}}{{4a}}} \right)\]
\[ \Rightarrow \,\,\left( {\dfrac{{ - 18}}{{2\left( 3 \right)}},\dfrac{{4\left( 3 \right)\left( {24} \right) - {{\left( {18} \right)}^2}}}{{4\left( 3 \right)}}} \right)\]
\[ \Rightarrow \,\,\left( {\dfrac{{ - 18}}{6},\dfrac{{288 - 324}}{{12}}} \right)\]
\[ \Rightarrow \,\,\left( { - 3, - 3} \right)\]
Vertex = \[\left( { - 3, - 3} \right)\]
Focus of the parabola = \[\left( {\dfrac{{ - b}}{{2a}},\dfrac{{4ac - {b^2} + 1}}{{4a}}} \right)\]
\[ \Rightarrow \,\,\left( {\dfrac{{ - 18}}{{2\left( 3 \right)}},\dfrac{{4\left( 3 \right)\left( {24} \right) - {{\left( {18} \right)}^2} + 1}}{{4\left( 3 \right)}}} \right)\]
\[ \Rightarrow \,\,\left( {\dfrac{{ - 18}}{6},\dfrac{{288 - 324 + 1}}{{12}}} \right)\]
\[ \Rightarrow \,\,\left( {\dfrac{{ - 18}}{6},\dfrac{{ - 36 + 1}}{{12}}} \right)\]
\[ \Rightarrow \,\,\left( {\dfrac{{ - 18}}{6},\dfrac{{ - 35}}{{12}}} \right)\]
Focus = \[\left( {\dfrac{{ - 18}}{6},\dfrac{{ - 35}}{{12}}} \right)\]
Directrix of parabola \[y = \dfrac{{4ac - {b^2} - 1}}{{4a}}\]
\[ \Rightarrow \,\,\dfrac{{4\left( 3 \right)\left( {24} \right) - {{\left( {18} \right)}^2} - 1}}{{4\left( 3 \right)}}\]
\[ \Rightarrow \,\,\dfrac{{288 - 324 - 1}}{{12}}\]
\[ \Rightarrow \,\,\dfrac{{ - 36 - 1}}{{12}}\]
\[ \Rightarrow \,\,\dfrac{{ - 37}}{{12}}\]
Directrix \[y = \dfrac{{ - 37}}{{12}}\]
Now putting in different values for x in the equation \[y = 3{\left( {x + 3} \right)^2} - 3\] and calculate the corresponding values for y.
When \[x = - 5 \Rightarrow y = 3{\left( { - 5 + 3} \right)^2} - 3 \Rightarrow y = 9\]
When \[x = - 4 \Rightarrow y = 3{\left( { - 4 + 3} \right)^2} - 3 \Rightarrow y = 0\]
When \[x = - 3 \Rightarrow y = 3{\left( { - 3 + 3} \right)^2} - 3 \Rightarrow y = - 3\]
When \[x = - 2 \Rightarrow y = 3{\left( { - 2 + 3} \right)^2} - 3 \Rightarrow y = 0\]
When \[x = - 1 \Rightarrow y = 3{\left( { - 1 + 3} \right)^2} - 3 \Rightarrow y = 9\]
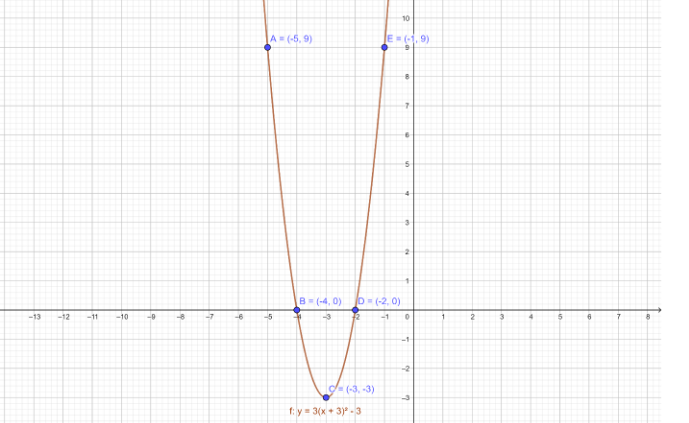
| \[x\] | \[ - 5\] | \[ - 4\] | \[ - 3\] | \[ - 2\] | \[ - 1\] |
| \[y\] | \[9\] | \[0\] | \[ - 3\] | \[0\] | \[9\] |
| \[\left( {x,y} \right)\] | \[\left( { - 5,9} \right)\] | \[\left( { - 4,0} \right)\] | \[\left( { - 3, - 3} \right)\] | \[\left( { - 2,0} \right)\] | \[\left( { - 1,9} \right)\] |
Now, plot the required graph:
we determine the values and finally we obtain the linear equation for y and hence we can plot the graph.
Note: The plotting of a graph is different here. When we plot the graph for the parabola we use different methods. Here in this question Vertex of Parabola = \[\left( {\dfrac{{ - b}}{{2a}},\dfrac{{4ac - {b^2}}}{{4a}}} \right)\] , Focus of the parabola = \[\left( {\dfrac{{ - b}}{{2a}},\dfrac{{4ac - {b^2} + 1}}{{4a}}} \right)\] , Directrix of parabola \[y = \dfrac{{4ac - {b^2} - 1}}{{4a}}\]
Recently Updated Pages
Master Class 11 Computer Science: Engaging Questions & Answers for Success
Master Class 11 Business Studies: Engaging Questions & Answers for Success
Master Class 11 Economics: Engaging Questions & Answers for Success
Master Class 11 English: Engaging Questions & Answers for Success
Master Class 11 Maths: Engaging Questions & Answers for Success
Master Class 11 Biology: Engaging Questions & Answers for Success
Trending doubts
One Metric ton is equal to kg A 10000 B 1000 C 100 class 11 physics CBSE
There are 720 permutations of the digits 1 2 3 4 5 class 11 maths CBSE
Discuss the various forms of bacteria class 11 biology CBSE
Draw a diagram of a plant cell and label at least eight class 11 biology CBSE
State the laws of reflection of light
Explain zero factorial class 11 maths CBSE