


Graph \[y = - 2x - 3\].
Answer
546k+ views
Hint: For plotting a graph we need different x values as well as their corresponding y values.
Such that to solve this question we need to find the x intercept, y intercept and some intermediate values. Also the x-intercept and y-intercept can be found by substituting y=0 and x=0 respectively.
After finding these values we just need to plot them on the XY plane.
Complete step by step solution:
Given
$y = - 2x - 3.......................\left( i \right)$
Now we need to find the x intercept, y intercept and some intermediate values for plotting the graph.
X intercept is the point where the graph touches X axis such that y=0, such that substituting y=0 in (i):
\[
\Rightarrow y = - 2x - 3 \\
\Rightarrow 0 = - 2x - 3 \\
\Rightarrow - 2x = 3 \\
\Rightarrow x = - \dfrac{3}{2} \\
\Rightarrow x = - 1.5.................\left( {ii} \right) \\
\]
\[\therefore {\text{x intercept}} = \left( { - 1.5,0} \right)\]
Now we need to find y intercept:
So we have to put x=0 in (i) since y intercept is the point where the graph touches the Y axis.
$
\Rightarrow y = - 2x - 3 \\
\Rightarrow y = - 2\left( 0 \right) - 3 \\
\Rightarrow y = - 3...................\left( {iii} \right) \\
$
\[\therefore y{\text{ intercept}} = \left( {0, - 3} \right)\]
Now let’s find some intermediate points:
For x=1:
$
\Rightarrow y = - 2x - 3 \\
\Rightarrow y = - 2 \times 1 - 3 \\
\Rightarrow y = - 2 - 3 \\
\Rightarrow y = - 5 \\
$
$\therefore \left( {1, - 5} \right)\;{\text{is}}\;{\text{a}}\;{\text{point}}{\text{.}}$
For x=-1
$
\Rightarrow y = - 2x - 3 \\
\Rightarrow y = - 2 \times - 1 - 3 \\
\Rightarrow y = 2 - 3 \\
\Rightarrow y = - 1 \\
$
\[\therefore \left( { - 1, - 1} \right)\;{\text{is}}\;{\text{a}}\;{\text{point}}{\text{.}}\]
Now all these values which we have got from above is to be plotted in a XY plane.
Plotting the points
\[\left( { - 1.5,0} \right),\left( {0, - 3} \right),\left( {1, - 5} \right),\left( { - 1, - 1} \right)\]
On plotting the above points we get the following graph:
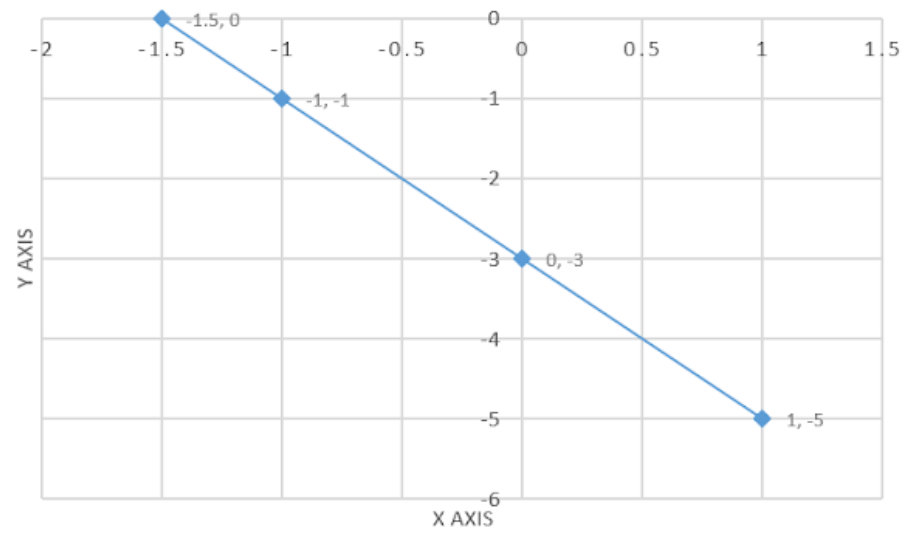
The above graph shows the plot of\[y = - 2x - 3\].
Note: While approaching a similar graphical question one should find as many points as possible from the given conditions and common knowledge. Also one must be careful while doing the solution. Also while plotting the graph one must choose appropriate scale considering the values that should be plotted such that our every value can be represented on the graph.
Such that to solve this question we need to find the x intercept, y intercept and some intermediate values. Also the x-intercept and y-intercept can be found by substituting y=0 and x=0 respectively.
After finding these values we just need to plot them on the XY plane.
Complete step by step solution:
Given
$y = - 2x - 3.......................\left( i \right)$
Now we need to find the x intercept, y intercept and some intermediate values for plotting the graph.
X intercept is the point where the graph touches X axis such that y=0, such that substituting y=0 in (i):
\[
\Rightarrow y = - 2x - 3 \\
\Rightarrow 0 = - 2x - 3 \\
\Rightarrow - 2x = 3 \\
\Rightarrow x = - \dfrac{3}{2} \\
\Rightarrow x = - 1.5.................\left( {ii} \right) \\
\]
\[\therefore {\text{x intercept}} = \left( { - 1.5,0} \right)\]
Now we need to find y intercept:
So we have to put x=0 in (i) since y intercept is the point where the graph touches the Y axis.
$
\Rightarrow y = - 2x - 3 \\
\Rightarrow y = - 2\left( 0 \right) - 3 \\
\Rightarrow y = - 3...................\left( {iii} \right) \\
$
\[\therefore y{\text{ intercept}} = \left( {0, - 3} \right)\]
Now let’s find some intermediate points:
For x=1:
$
\Rightarrow y = - 2x - 3 \\
\Rightarrow y = - 2 \times 1 - 3 \\
\Rightarrow y = - 2 - 3 \\
\Rightarrow y = - 5 \\
$
$\therefore \left( {1, - 5} \right)\;{\text{is}}\;{\text{a}}\;{\text{point}}{\text{.}}$
For x=-1
$
\Rightarrow y = - 2x - 3 \\
\Rightarrow y = - 2 \times - 1 - 3 \\
\Rightarrow y = 2 - 3 \\
\Rightarrow y = - 1 \\
$
\[\therefore \left( { - 1, - 1} \right)\;{\text{is}}\;{\text{a}}\;{\text{point}}{\text{.}}\]
Now all these values which we have got from above is to be plotted in a XY plane.
Plotting the points
\[\left( { - 1.5,0} \right),\left( {0, - 3} \right),\left( {1, - 5} \right),\left( { - 1, - 1} \right)\]
| X | Y |
| -1.5 | 0 |
| 0 | -3 |
| 1 | -5 |
| -1 | -1 |
On plotting the above points we get the following graph:
The above graph shows the plot of\[y = - 2x - 3\].
Note: While approaching a similar graphical question one should find as many points as possible from the given conditions and common knowledge. Also one must be careful while doing the solution. Also while plotting the graph one must choose appropriate scale considering the values that should be plotted such that our every value can be represented on the graph.
Recently Updated Pages
Master Class 9 General Knowledge: Engaging Questions & Answers for Success
Master Class 9 Social Science: Engaging Questions & Answers for Success
Master Class 9 English: Engaging Questions & Answers for Success
Master Class 9 Maths: Engaging Questions & Answers for Success
Master Class 9 Science: Engaging Questions & Answers for Success
Class 9 Question and Answer - Your Ultimate Solutions Guide
Trending doubts
Difference Between Plant Cell and Animal Cell
Fill the blanks with the suitable prepositions 1 The class 9 english CBSE
Who is eligible for RTE class 9 social science CBSE
Which places in India experience sunrise first and class 9 social science CBSE
What is pollution? How many types of pollution? Define it
Name 10 Living and Non living things class 9 biology CBSE