


How do you graph $y = 2x + 1$ using a table?
Answer
580.2k+ views
Hint:A graph is a visual diagram used to represent equations or functions or any statistical information. To plot a graph for an equation, we must know the coordinates of the graph. Coordinates of the graph can be found by assuming certain values for either $x$ or $y$ in the given equation and then finding out the value of another variable with the help of it.
Complete step by step solution:
The given equation for which the graph shall be plotted is $y = 2x + 1$.
Firstly let us take $x = 0$, so
$
y = 2 \times 0 + 1 \\
\Rightarrow y = 1 \\
$
When $x = 0$, $y = 1$.
Secondly let us take $x = 1$, so
$
y = 2 \times 1 + 1 \\
\Rightarrow y = 2 + 1 \\
\Rightarrow y = 3 \\
$
When $x = 1$, $y = 3$.
Lastly let us take $x = - 1$, so
$
y = 2 \times - 1 + 1 \\
\Rightarrow y = - 2 + 1 \\
\Rightarrow y = - 1 \\
$
When $x = - 1$, $y = - 1$.
So we obtain a table given below:
With the help of this table, we can locate the coordinates $(x,y)$ given and hence plot a graph given below:
Note: Coordinates are a set of values that show an exact position. On graphs, it is usually a pair of numbers. The first number shows the distance along the $x$ axis or the horizontal axis and the second number shows the distance along the $y$ axis or the vertical axis. Also, coordinates can have three numbers where the third number is used to denote the distance along the $z$ axis. Such coordinates are used to locate points in 3d or space.
Complete step by step solution:
The given equation for which the graph shall be plotted is $y = 2x + 1$.
Firstly let us take $x = 0$, so
$
y = 2 \times 0 + 1 \\
\Rightarrow y = 1 \\
$
When $x = 0$, $y = 1$.
Secondly let us take $x = 1$, so
$
y = 2 \times 1 + 1 \\
\Rightarrow y = 2 + 1 \\
\Rightarrow y = 3 \\
$
When $x = 1$, $y = 3$.
Lastly let us take $x = - 1$, so
$
y = 2 \times - 1 + 1 \\
\Rightarrow y = - 2 + 1 \\
\Rightarrow y = - 1 \\
$
When $x = - 1$, $y = - 1$.
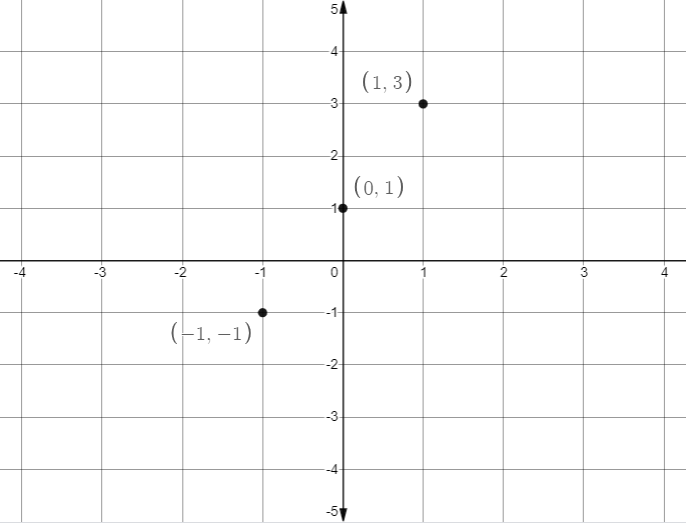
So we obtain a table given below:
| $x$ | $0$ | $1$ | $ - 1$ |
| $y$ | $1$ | $3$ | $ - 1$ |
With the help of this table, we can locate the coordinates $(x,y)$ given and hence plot a graph given below:
Note: Coordinates are a set of values that show an exact position. On graphs, it is usually a pair of numbers. The first number shows the distance along the $x$ axis or the horizontal axis and the second number shows the distance along the $y$ axis or the vertical axis. Also, coordinates can have three numbers where the third number is used to denote the distance along the $z$ axis. Such coordinates are used to locate points in 3d or space.

Recently Updated Pages
Master Class 10 Computer Science: Engaging Questions & Answers for Success
Master Class 10 General Knowledge: Engaging Questions & Answers for Success
Master Class 10 English: Engaging Questions & Answers for Success
Master Class 10 Social Science: Engaging Questions & Answers for Success
Master Class 10 Maths: Engaging Questions & Answers for Success
Master Class 10 Science: Engaging Questions & Answers for Success
Trending doubts
What is BLO What is the full form of BLO class 8 social science CBSE
What are the 12 elements of nature class 8 chemistry CBSE
Citizens of India can vote at the age of A 18 years class 8 social science CBSE
Name the states through which the Tropic of Cancer class 8 social science CBSE
Advantages and disadvantages of science
Right to vote is a AFundamental Right BFundamental class 8 social science CBSE