


How do you graph $ y = 2\cos \left( {2x} \right) $ ?
Answer
528.3k+ views
Hint: A graph of a function f is the set of ordered pairs; the equation of the graph is generally represented as $ y = f\left( x \right) $ , where x and $ f\left( x \right) $ are real numbers. We substitute the value of x and we determine the value of y and then we mark the points in the graph and we join the points.
Complete step by step solution:
Here, in the given question, we have to plot the graph for the given function. A graph of a function is a set of ordered pairs and it is represented as $ y = f\left( x \right) $ , where x and $ f\left( x \right) $ are real numbers. These pairs are in the cartesian form and the graph is the two-dimensional graph.
First, we have to find the value of y by using the graph equation $ y = 2\cos \left( {2x} \right) $ .
Let us substitute the value of x as $ \dfrac{\pi }{2} $ .
$ \Rightarrow y = 2\cos \left( {2 \times \dfrac{\pi }{2}} \right) $
$ \Rightarrow y = 2\cos \left( \pi \right) $
We know that the value of $ \cos \left( \pi \right) $ is $ \left( { - 1} \right) $ . So, we get,
$ \Rightarrow y = 2\left( { - 1} \right) $
$ \Rightarrow y = - 2 $
Now we consider the value of x as $ \pi $ , the value of y is
$ \Rightarrow y = 2\cos \left( {2 \times \pi } \right) $
$ \Rightarrow y = 2\cos \left( {2\pi } \right) $
$ \Rightarrow y = 2 \times 1 $
$ \Rightarrow y = 2 $
Now we consider the value of x as $ \left( {\dfrac{\pi }{4}} \right) $ , the value of y is
$ \Rightarrow y = 2\cos \left( {2 \times \dfrac{\pi }{4}} \right) $
$ \Rightarrow y = 2\cos \left( {\dfrac{\pi }{2}} \right) $
Now, we know that the value of $ \cos \left( {\dfrac{\pi }{2}} \right) $ is zero. So, we get the value of expression as
$ \Rightarrow y = 2 \times 0 $
$ \Rightarrow y = 0 $
Now, we draw a table for these values we have,
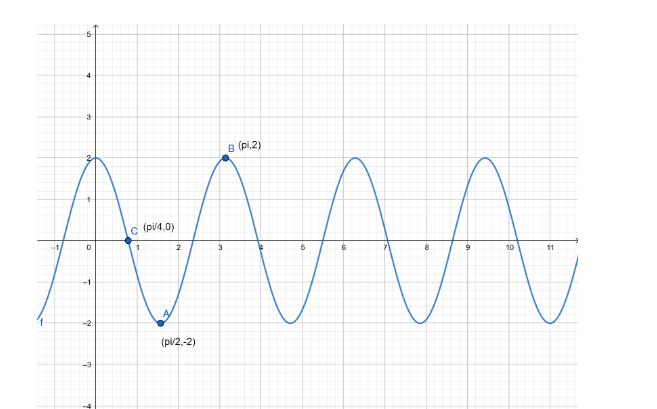
We also know the nature of the graph of cosine function. Hence, we can now plot the graph of the given function $ y = 2\cos \left( {2x} \right) $ with the help of coordinates of the point lying on it. The graph plotted for these points is represented below:
Note: The cosine function can be represented by the general equation $ y = a\cos \left( {kx + \phi } \right) $ . There are various parameters in this equation such as the amplitude, period and phase shift of the sine function. The value ‘a’ is the amplitude of the cosine function $ y = a\cos \left( {kx + \phi } \right) $ . The period of the cosine function can be calculated as $ \left( {\dfrac{{2\pi }}{k}} \right) $ as the value of the function repeats after regular interval of $ \left( {\dfrac{{2\pi }}{k}} \right) $ radians. Also, if there is a constant added in the function like $ y = a\cos \left( {kx + \phi } \right) $ , then the graph of the function moves p units vertically upwards due to the upward shift.
Complete step by step solution:
Here, in the given question, we have to plot the graph for the given function. A graph of a function is a set of ordered pairs and it is represented as $ y = f\left( x \right) $ , where x and $ f\left( x \right) $ are real numbers. These pairs are in the cartesian form and the graph is the two-dimensional graph.
First, we have to find the value of y by using the graph equation $ y = 2\cos \left( {2x} \right) $ .
Let us substitute the value of x as $ \dfrac{\pi }{2} $ .
$ \Rightarrow y = 2\cos \left( {2 \times \dfrac{\pi }{2}} \right) $
$ \Rightarrow y = 2\cos \left( \pi \right) $
We know that the value of $ \cos \left( \pi \right) $ is $ \left( { - 1} \right) $ . So, we get,
$ \Rightarrow y = 2\left( { - 1} \right) $
$ \Rightarrow y = - 2 $
Now we consider the value of x as $ \pi $ , the value of y is
$ \Rightarrow y = 2\cos \left( {2 \times \pi } \right) $
$ \Rightarrow y = 2\cos \left( {2\pi } \right) $
$ \Rightarrow y = 2 \times 1 $
$ \Rightarrow y = 2 $
Now we consider the value of x as $ \left( {\dfrac{\pi }{4}} \right) $ , the value of y is
$ \Rightarrow y = 2\cos \left( {2 \times \dfrac{\pi }{4}} \right) $
$ \Rightarrow y = 2\cos \left( {\dfrac{\pi }{2}} \right) $
Now, we know that the value of $ \cos \left( {\dfrac{\pi }{2}} \right) $ is zero. So, we get the value of expression as
$ \Rightarrow y = 2 \times 0 $
$ \Rightarrow y = 0 $
Now, we draw a table for these values we have,
| X | $ \dfrac{\pi }{2} $ | $ \pi $ | $ \left( {\dfrac{\pi }{4}} \right) $ |
| y | $ - 2 $ | $ 2 $ | $ 0 $ |
We also know the nature of the graph of cosine function. Hence, we can now plot the graph of the given function $ y = 2\cos \left( {2x} \right) $ with the help of coordinates of the point lying on it. The graph plotted for these points is represented below:
Note: The cosine function can be represented by the general equation $ y = a\cos \left( {kx + \phi } \right) $ . There are various parameters in this equation such as the amplitude, period and phase shift of the sine function. The value ‘a’ is the amplitude of the cosine function $ y = a\cos \left( {kx + \phi } \right) $ . The period of the cosine function can be calculated as $ \left( {\dfrac{{2\pi }}{k}} \right) $ as the value of the function repeats after regular interval of $ \left( {\dfrac{{2\pi }}{k}} \right) $ radians. Also, if there is a constant added in the function like $ y = a\cos \left( {kx + \phi } \right) $ , then the graph of the function moves p units vertically upwards due to the upward shift.
Recently Updated Pages
Master Class 11 Computer Science: Engaging Questions & Answers for Success
Master Class 11 Business Studies: Engaging Questions & Answers for Success
Master Class 11 Economics: Engaging Questions & Answers for Success
Master Class 11 English: Engaging Questions & Answers for Success
Master Class 11 Maths: Engaging Questions & Answers for Success
Master Class 11 Biology: Engaging Questions & Answers for Success
Trending doubts
One Metric ton is equal to kg A 10000 B 1000 C 100 class 11 physics CBSE
There are 720 permutations of the digits 1 2 3 4 5 class 11 maths CBSE
Discuss the various forms of bacteria class 11 biology CBSE
Draw a diagram of a plant cell and label at least eight class 11 biology CBSE
State the laws of reflection of light
Explain zero factorial class 11 maths CBSE