


How do you graph \[x-2y=1\] using the intercepts?
Answer
594.6k+ views
Hint: We can draw the graph using intercepts concept. First we have to find the \[x\] and \[y\] intercepts. we have to make \[x\] as \[0\] while calculating y intercept and we have to make \[y\] as \[0\] while calculating \[x\] intercept. By solving this we can get the \[x\] and \[y\] intercepts to draw the graph.
Complete step by step answer:
Given equation is
\[x-2y=1\]
Now we have to find the \[x\] intercept of the equation.
To find it we have to substitute the \[y\] value with \[0\].
By substituting it and simplifying it we will get the \[x\] intercept .
Now we are going to substitute \[y=0\] in the equation.
We will get
\[\Rightarrow x-2\left( 0 \right)=1\]
\[\Rightarrow x-0=1\]
From this we can write
\[\Rightarrow x=1\]
So the \[x\] intercept of the equation is \[1\]
The point to plot on the graph is \[\left( 1,0 \right)\]
Now we have to find the \[y\] intercept of the equation.
To find it we have to substitute the \[x\] value with \[0\].
By substituting it and simplifying it we will get the \[y\] intercept .
Now we are going to substitute \[x=0\] in the equation.
We will get
\[\Rightarrow 0-2y=1\]
\[\Rightarrow -2y=1\]
We have to divide the equation with \[2\] on both sides
From this we can write
\[\Rightarrow \dfrac{-2y}{2}=\dfrac{1}{2}\]
By simplifying it we will get
\[\Rightarrow -y=0.5\]
To find the value of \[y\] we have to multiply the equation with the\[-\] sign.
We will get
\[\Rightarrow y=-0.5\]
So the \[y\] intercept of the equation is \[-0.5\]
The point to plot on the graph is \[\left( 0,-0.5 \right)\]
So the intercepts of \[x\] and \[y\] are \[1\] and \[-0.5\] respectively.
Now we have to plot the graph it will look like
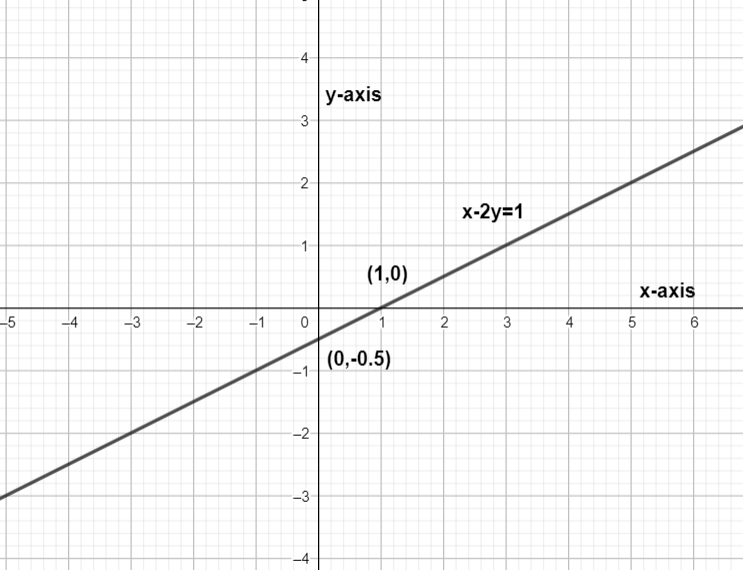
Note: We can also take different values for \[x\] and \[y\] and plot the graph. But here it is mentioned as an intercept we are taking the values as \[0\] otherwise we can take the values of our own choice and draw the graph.
Complete step by step answer:
Given equation is
\[x-2y=1\]
Now we have to find the \[x\] intercept of the equation.
To find it we have to substitute the \[y\] value with \[0\].
By substituting it and simplifying it we will get the \[x\] intercept .
Now we are going to substitute \[y=0\] in the equation.
We will get
\[\Rightarrow x-2\left( 0 \right)=1\]
\[\Rightarrow x-0=1\]
From this we can write
\[\Rightarrow x=1\]
So the \[x\] intercept of the equation is \[1\]
The point to plot on the graph is \[\left( 1,0 \right)\]
Now we have to find the \[y\] intercept of the equation.
To find it we have to substitute the \[x\] value with \[0\].
By substituting it and simplifying it we will get the \[y\] intercept .
Now we are going to substitute \[x=0\] in the equation.
We will get
\[\Rightarrow 0-2y=1\]
\[\Rightarrow -2y=1\]
We have to divide the equation with \[2\] on both sides
From this we can write
\[\Rightarrow \dfrac{-2y}{2}=\dfrac{1}{2}\]
By simplifying it we will get
\[\Rightarrow -y=0.5\]
To find the value of \[y\] we have to multiply the equation with the\[-\] sign.
We will get
\[\Rightarrow y=-0.5\]
So the \[y\] intercept of the equation is \[-0.5\]
The point to plot on the graph is \[\left( 0,-0.5 \right)\]
So the intercepts of \[x\] and \[y\] are \[1\] and \[-0.5\] respectively.
Now we have to plot the graph it will look like
Note: We can also take different values for \[x\] and \[y\] and plot the graph. But here it is mentioned as an intercept we are taking the values as \[0\] otherwise we can take the values of our own choice and draw the graph.
Recently Updated Pages
Master Class 11 English: Engaging Questions & Answers for Success
Master Class 11 Social Science: Engaging Questions & Answers for Success
Master Class 11 Maths: Engaging Questions & Answers for Success
Master Class 11 Biology: Engaging Questions & Answers for Success
Master Class 11 Physics: Engaging Questions & Answers for Success
Master Class 11 Chemistry: Engaging Questions & Answers for Success
Trending doubts
1 ton equals to A 100 kg B 1000 kg C 10 kg D 10000 class 11 physics CBSE
Find the value of the expression given below sin 30circ class 11 maths CBSE
What are hard magnetic materials class 11 physics CBSE
1 Quintal is equal to a 110 kg b 10 kg c 100kg d 1000 class 11 physics CBSE
Draw a diagram showing the external features of fish class 11 biology CBSE
What organs are located on the left side of your body class 11 biology CBSE