


How do you graph \[x - y = 3\] using a table of values?
Answer
582.9k+ views
Hint: We need to draw the graph ‘x’ versus ‘y’. We give the random values for ‘x’ and we find the value of ‘y’. We can give all real numbers for the value of ‘x’. Thus we will have coordinate points (x, y). Hence, we can plot the graph by using the values. Here we can give all real numbers to ‘x’. We can also draw the graph using the intercept method.
Complete step-by-step answer:
Given \[x - y = 3\].
Rearranging the equation we have,
\[x - 3 = y\]
\[y = x - 3\]
Let's give the values for ‘x’ and we find the value of ‘y’.
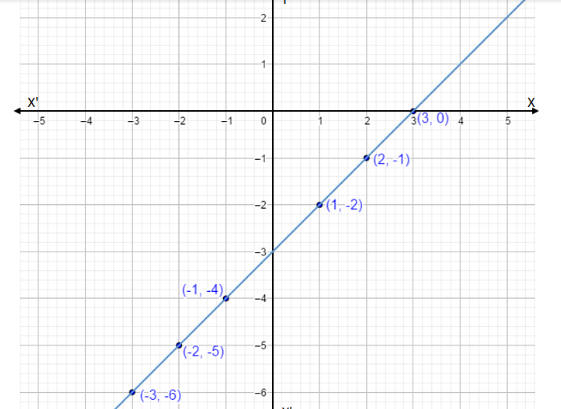
Put \[x = 1\]in \[y = x - 3\] we have,
\[y = 1 - 3 = - 2\]
Thus we have coordinate points \[(1, - 2)\].
Put \[x = - 1\]in \[y = x - 3\] we have,
\[y = - 1 - 3 = - 4\]
Thus we have coordinate point \[( - 1, - 4)\].
Put \[x = 2\]in \[y = x - 3\] we have,
\[y = 2 - 3 = - 1\]
Thus we have coordinate point \[(2, - 1)\].
Put \[x = - 2\]in \[y = x - 3\] we have,
\[y = - 2 - 3 = - 5\]
Thus we have coordinate point \[( - 2, - 5)\].
Put \[x = 3\]in \[y = x - 3\] we have,
\[y = 3 - 3 = 0\]
Thus we have coordinate point \[(3,0)\].
Put \[x = - 3\]in \[y = x - 3\] we have,
\[y = - 3 - 3 = - 6\]
Thus we have coordinate point after rounding off is \[( - 3, - 6)\]
Thus we have,
Let’s draw the graph for these coordinates,
Note: A graph shows the relation between two variable quantities, it contains two axes perpendicular to each other namely the x-axis and the y-axis. Each variable is measured along one of the axes. In the question, we are given one linear equation containing two variables namely x and y, x is measured along the x-axis and y is measured along the y-axis while tracing the given equations
Complete step-by-step answer:
Given \[x - y = 3\].
Rearranging the equation we have,
\[x - 3 = y\]
\[y = x - 3\]
Let's give the values for ‘x’ and we find the value of ‘y’.
Put \[x = 1\]in \[y = x - 3\] we have,
\[y = 1 - 3 = - 2\]
Thus we have coordinate points \[(1, - 2)\].
Put \[x = - 1\]in \[y = x - 3\] we have,
\[y = - 1 - 3 = - 4\]
Thus we have coordinate point \[( - 1, - 4)\].
Put \[x = 2\]in \[y = x - 3\] we have,
\[y = 2 - 3 = - 1\]
Thus we have coordinate point \[(2, - 1)\].
Put \[x = - 2\]in \[y = x - 3\] we have,
\[y = - 2 - 3 = - 5\]
Thus we have coordinate point \[( - 2, - 5)\].
Put \[x = 3\]in \[y = x - 3\] we have,
\[y = 3 - 3 = 0\]
Thus we have coordinate point \[(3,0)\].
Put \[x = - 3\]in \[y = x - 3\] we have,
\[y = - 3 - 3 = - 6\]
Thus we have coordinate point after rounding off is \[( - 3, - 6)\]
Thus we have,
| \[x\] | \[1\] | \[ - 1\] | \[2\] | \[ - 2\] | \[3\] | \[ - 3\] |
| \[y\] | \[ - 2\] | \[ - 4\] | \[ - 1\] | \[ - 5\] | \[0\] | \[ - 6\] |
Let’s draw the graph for these coordinates,
Note: A graph shows the relation between two variable quantities, it contains two axes perpendicular to each other namely the x-axis and the y-axis. Each variable is measured along one of the axes. In the question, we are given one linear equation containing two variables namely x and y, x is measured along the x-axis and y is measured along the y-axis while tracing the given equations

Recently Updated Pages
Master Class 11 English: Engaging Questions & Answers for Success
Master Class 11 Social Science: Engaging Questions & Answers for Success
Master Class 11 Maths: Engaging Questions & Answers for Success
Master Class 11 Biology: Engaging Questions & Answers for Success
Master Class 11 Physics: Engaging Questions & Answers for Success
Master Class 11 Chemistry: Engaging Questions & Answers for Success
Trending doubts
What is BLO What is the full form of BLO class 8 social science CBSE
Citizens of India can vote at the age of A 18 years class 8 social science CBSE
Full form of STD, ISD and PCO
Advantages and disadvantages of science
What is the difference between rai and mustard see class 8 biology CBSE
What is the collective noun for soldiers class 8 english CBSE