


How do you graph $x+3y=6$ using intercepts?
Answer
584.7k+ views
Hint: We will look at the definition of an intercept. Then we will find the x-intercept and the y-intercept from the given equation. We will use the interpretation of these intercepts to plot the graph of the given equation. We will verify that the type of given equation and its representation as a graph are correct.
Complete step by step answer:
We define the intercept to be the point where the line intersects either axes on the cartesian plane. So, the x-intercept is the point at which the line intersects the x-axis. Similarly, the y-intercept is the point at which the line intersects the y-axis. Since the x-intercept is the intersection of the line with the x-axis, we can find it by substituting $y=0$ in the equation of the line. The given equation is $x+3y=6$. Now, substituting $y=0$ in this equation we get
$\begin{align}
& x+3\left( 0 \right)=6 \\
& \therefore x=6 \\
\end{align}$
The x-intercept is $\left( 6,0 \right)$. Similarly, we will find the y-intercept. The y-intercept is the intersection of the line with the y-axis. So, we can find it by substituting $x=0$ in the equation of the line. Therefore, substituting $x=0$ in this equation we get
$\begin{align}
& 0+3y=6 \\
& \Rightarrow 3y=6 \\
& \therefore y=2 \\
\end{align}$
So, the y-intercept is $\left( 0,2 \right)$. Now, according to the definition of the intercept, we know that the line represented by the given equation passes through the x-intercept and the y-intercept, which are the points $\left( 6,0 \right)$ and $\left( 0,2 \right)$. The given equation is a linear equation. We know that only one line passes through two points. So, we can draw the graph of the given equation as a line passing through the x-intercept and y-intercept.
The graph looks like the following,
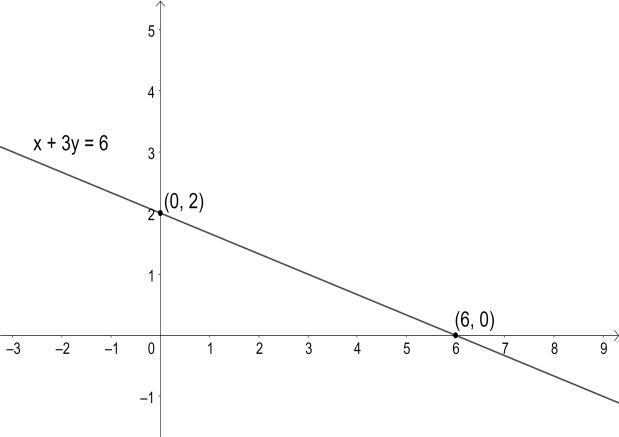
The linear equation represents a graph of a straight line, which is as expected.
Note: The graph of a linear equation is a line. The graph of a quadratic equation is a parabola. By analyzing the equation given, we can infer certain details about the graph it represents. These details include intercepts or vertices of a parabola representing a quadratic equation. It is important to understand these concepts so that solving equations and interpreting them becomes intuitive.
Complete step by step answer:
We define the intercept to be the point where the line intersects either axes on the cartesian plane. So, the x-intercept is the point at which the line intersects the x-axis. Similarly, the y-intercept is the point at which the line intersects the y-axis. Since the x-intercept is the intersection of the line with the x-axis, we can find it by substituting $y=0$ in the equation of the line. The given equation is $x+3y=6$. Now, substituting $y=0$ in this equation we get
$\begin{align}
& x+3\left( 0 \right)=6 \\
& \therefore x=6 \\
\end{align}$
The x-intercept is $\left( 6,0 \right)$. Similarly, we will find the y-intercept. The y-intercept is the intersection of the line with the y-axis. So, we can find it by substituting $x=0$ in the equation of the line. Therefore, substituting $x=0$ in this equation we get
$\begin{align}
& 0+3y=6 \\
& \Rightarrow 3y=6 \\
& \therefore y=2 \\
\end{align}$
So, the y-intercept is $\left( 0,2 \right)$. Now, according to the definition of the intercept, we know that the line represented by the given equation passes through the x-intercept and the y-intercept, which are the points $\left( 6,0 \right)$ and $\left( 0,2 \right)$. The given equation is a linear equation. We know that only one line passes through two points. So, we can draw the graph of the given equation as a line passing through the x-intercept and y-intercept.
The graph looks like the following,
The linear equation represents a graph of a straight line, which is as expected.
Note: The graph of a linear equation is a line. The graph of a quadratic equation is a parabola. By analyzing the equation given, we can infer certain details about the graph it represents. These details include intercepts or vertices of a parabola representing a quadratic equation. It is important to understand these concepts so that solving equations and interpreting them becomes intuitive.
Recently Updated Pages
Three beakers labelled as A B and C each containing 25 mL of water were taken A small amount of NaOH anhydrous CuSO4 and NaCl were added to the beakers A B and C respectively It was observed that there was an increase in the temperature of the solutions contained in beakers A and B whereas in case of beaker C the temperature of the solution falls Which one of the following statements isarecorrect i In beakers A and B exothermic process has occurred ii In beakers A and B endothermic process has occurred iii In beaker C exothermic process has occurred iv In beaker C endothermic process has occurred
Master Class 9 Social Science: Engaging Questions & Answers for Success
Master Class 9 Science: Engaging Questions & Answers for Success
Master Class 9 Maths: Engaging Questions & Answers for Success
Master Class 9 General Knowledge: Engaging Questions & Answers for Success
Class 9 Question and Answer - Your Ultimate Solutions Guide
Three beakers labelled as A B and C each containing 25 mL of water were taken A small amount of NaOH anhydrous CuSO4 and NaCl were added to the beakers A B and C respectively It was observed that there was an increase in the temperature of the solutions contained in beakers A and B whereas in case of beaker C the temperature of the solution falls Which one of the following statements isarecorrect i In beakers A and B exothermic process has occurred ii In beakers A and B endothermic process has occurred iii In beaker C exothermic process has occurred iv In beaker C endothermic process has occurred
Master Class 9 Social Science: Engaging Questions & Answers for Success
Master Class 9 Science: Engaging Questions & Answers for Success
Trending doubts
Find the sum of series 1 + 2 + 3 + 4 + 5 + + 100 class 9 maths CBSE
Fill the blanks with the suitable prepositions 1 The class 9 english CBSE
Difference Between Plant Cell and Animal Cell
What is pollution? How many types of pollution? Define it
Name 10 Living and Non living things class 9 biology CBSE
Which are the Top 10 Largest States of India?