


How do you graph the system of linear inequalities $ x \geqslant - 7 $ , $ y < 10 $ and $ x < y $ ?
Answer
522.6k+ views
Hint: In order to graph the linear inequalities, we should know what the inequalities are first. Inequality is an equation which is not equal, that means the left and right side are not equal. One side is either less than, greater than, less than equal to or greater than equal to the other side.
Complete step-by-step answer:
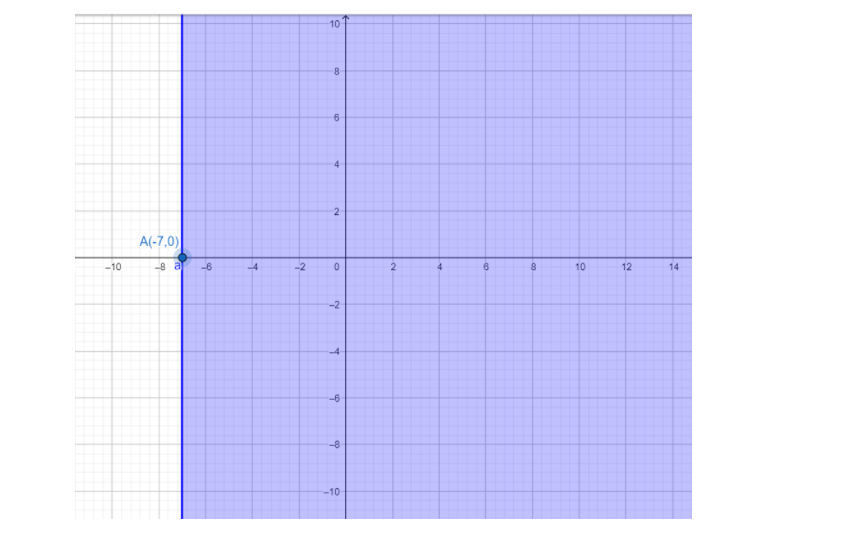
The first inequality we have is: $ x \geqslant - 7 $ . For this we can see that it is a single variable inequation consisting only $ x $ , that means the value of $ y $ is zero. The line obtained by plotting the point would be parallel to y-axis. So, the area becomes the area greater than the $ - 7 $ including $ - 7 $ .
And, the graph obtained is:
The next inequality, we have is $ y < 10 $ , in this inequation also there is only one variable $ y $ , so the other variable $ x $ is zero and the line obtained would be parallel to x-axis. So, the area becomes less than $ 10 $ in which the value of $ 10 $ is not included, the area towards zero. And, the graph we get is:
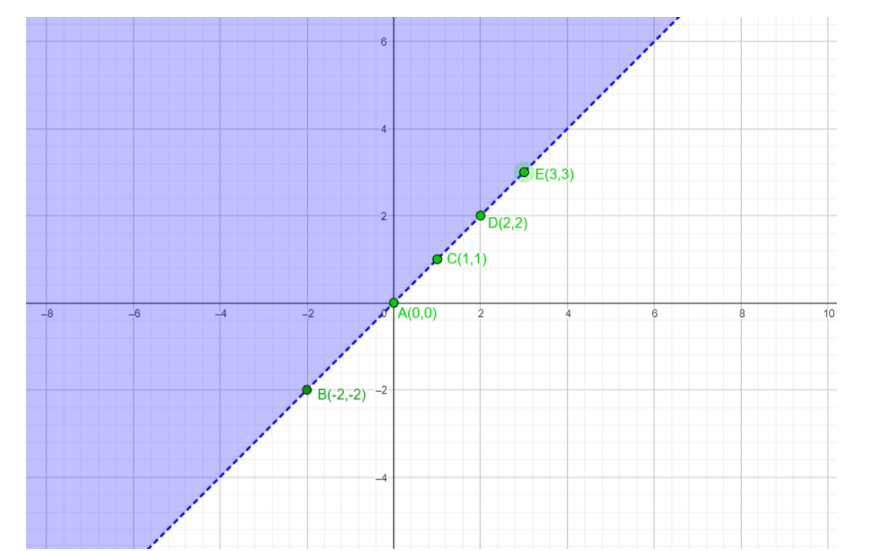
The third inequation we have is $ x < y $ . To solve this inequation let’s consider the inequality sign as the equality sign and finding the graph of the line.
Subtracting both the sides by $ y $ , and we get:
$
x - y = y - y \\
x - y = 0 \;
$
Making a table of some points to draw the line:
Plotting the points and making the graph accordingly. Since, the value is $ x < y $ , only greater than not greater than equal to so the line drawn would not be included.
The graph obtained is:
Therefore, the system of linear inequalities for $ x \geqslant - 7 $ , $ y < 10 $ and $ x < y $ is obtained by combining the above three graphs and, we get:
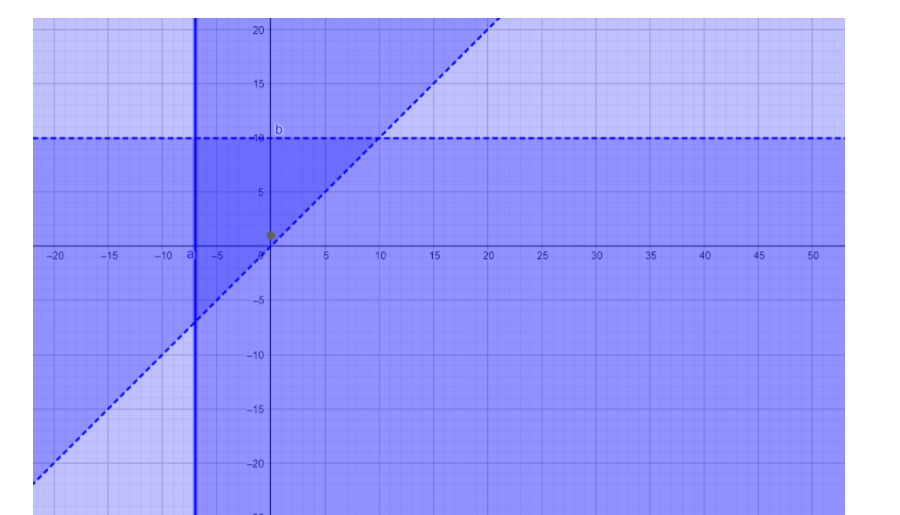
The darker blue portion on the graph represents the area combined with the three inequalities.
Note: There are two types of line we got above, one is normal line and other two are dotted, this is because in the first inequality it was included equal to, which means the value of the line is also included, whereas in other two it's only greater than or less than not equal to, so the line was not included and it gave a dotted line.
Complete step-by-step answer:
The first inequality we have is: $ x \geqslant - 7 $ . For this we can see that it is a single variable inequation consisting only $ x $ , that means the value of $ y $ is zero. The line obtained by plotting the point would be parallel to y-axis. So, the area becomes the area greater than the $ - 7 $ including $ - 7 $ .
And, the graph obtained is:
The next inequality, we have is $ y < 10 $ , in this inequation also there is only one variable $ y $ , so the other variable $ x $ is zero and the line obtained would be parallel to x-axis. So, the area becomes less than $ 10 $ in which the value of $ 10 $ is not included, the area towards zero. And, the graph we get is:
The third inequation we have is $ x < y $ . To solve this inequation let’s consider the inequality sign as the equality sign and finding the graph of the line.
Subtracting both the sides by $ y $ , and we get:
$
x - y = y - y \\
x - y = 0 \;
$
Making a table of some points to draw the line:
| X | -2 | 0 | 1 | 2 | 3 |
| y | -2 | 0 | 1 | 2 | 3 |
Plotting the points and making the graph accordingly. Since, the value is $ x < y $ , only greater than not greater than equal to so the line drawn would not be included.
The graph obtained is:
Therefore, the system of linear inequalities for $ x \geqslant - 7 $ , $ y < 10 $ and $ x < y $ is obtained by combining the above three graphs and, we get:
The darker blue portion on the graph represents the area combined with the three inequalities.
Note: There are two types of line we got above, one is normal line and other two are dotted, this is because in the first inequality it was included equal to, which means the value of the line is also included, whereas in other two it's only greater than or less than not equal to, so the line was not included and it gave a dotted line.

Recently Updated Pages
Master Class 8 Social Science: Engaging Questions & Answers for Success
Master Class 8 English: Engaging Questions & Answers for Success
Class 8 Question and Answer - Your Ultimate Solutions Guide
Master Class 8 Maths: Engaging Questions & Answers for Success
Master Class 8 Science: Engaging Questions & Answers for Success
Master Class 9 General Knowledge: Engaging Questions & Answers for Success
Trending doubts
What is BLO What is the full form of BLO class 8 social science CBSE
Citizens of India can vote at the age of A 18 years class 8 social science CBSE
Full form of STD, ISD and PCO
Advantages and disadvantages of science
Right to vote is a AFundamental Right BFundamental class 8 social science CBSE
What are the 12 elements of nature class 8 chemistry CBSE