


How do you graph the system of linear inequalities $y\ge 1$ and $x\le 6$ and $y< 2x-5$?
Answer
538.8k+ views
Hint: First of all, we need to graph the equalities $y=1$, $x=6$, and $y=2x-5$. Then we have to consider the corresponding inequalities to graph them with the lines of inequalities as the boundaries of their respective regions. The region corresponding to $y\ge 1$ will be above the line $y=1$. The region for $x\le 6$ will be to the left of $x=6$. And for $y<2x-5$ we need to substitute the origin and check whether it satisfies it or not. If it satisfies, then the region towards the origin will be shaded, but if it does not satisfy then the opposite region will be shaded. Finally considering the common region to all the three regions will be the final graph.
Complete step by step solution:
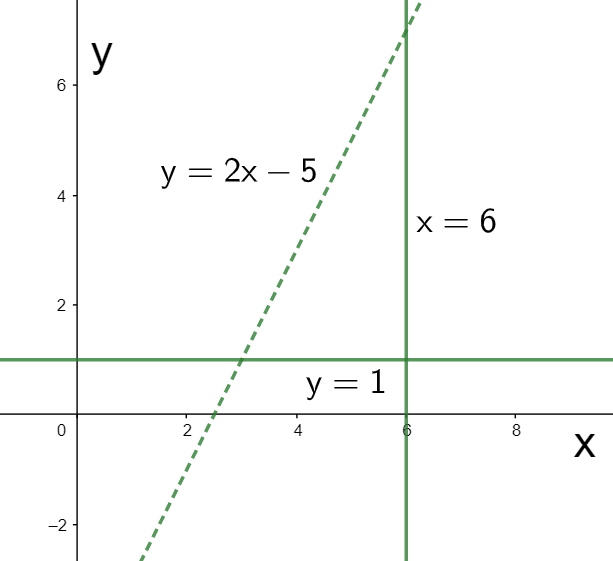
The inequalities given to us in the question are $y\ge 1$, $x\le 6$, and $y<2x-5$. To graph them, we first consider the corresponding equalities $y=1$, $x=6$, and $y=2x-5$. The graph of these is shown in the figure below.
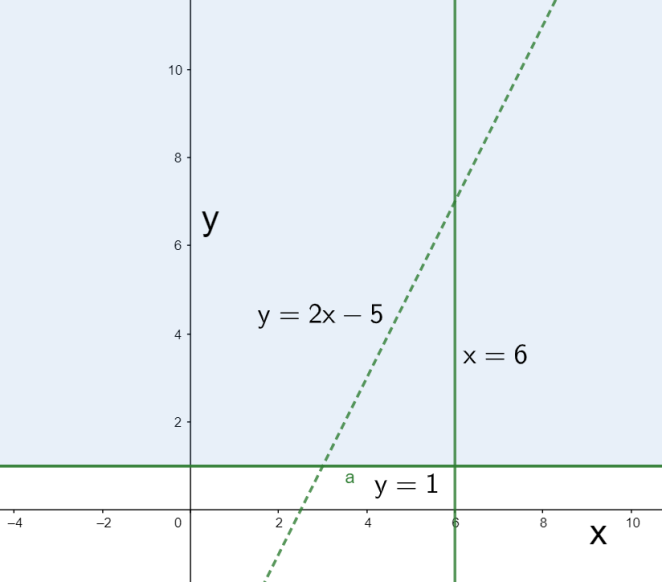
Now, for representing the graph of the inequalities, we need to shade the region for each of the inequalities. Considering the first inequality, we have $y\ge 1$. This means the region above the $y=1$ will be shaded as shown below.
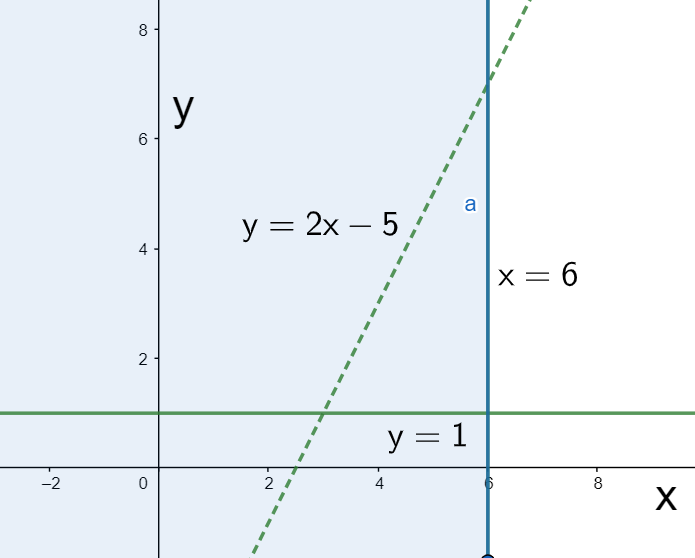
Now, considering the second inequality, we have $x\le 6$. This inequality will be represented by the region to the left of the line $x=6$ as shown below.
Finally, considering the third inequality, we have $y<2x-5$. On substituting $x=0,y=0$ in the inequality, we get
\[\begin{align}
& \Rightarrow 0<2\left( 0 \right)-5 \\
& \Rightarrow 0<-5 \\
\end{align}\]
The above inequality is clearly incorrect since we know that $0>-5$. This means that the origin does not satisfy the inequality $y<2x-5$, which in turn means that the region represented by this inequality will be shaded away from the origin as shown below.
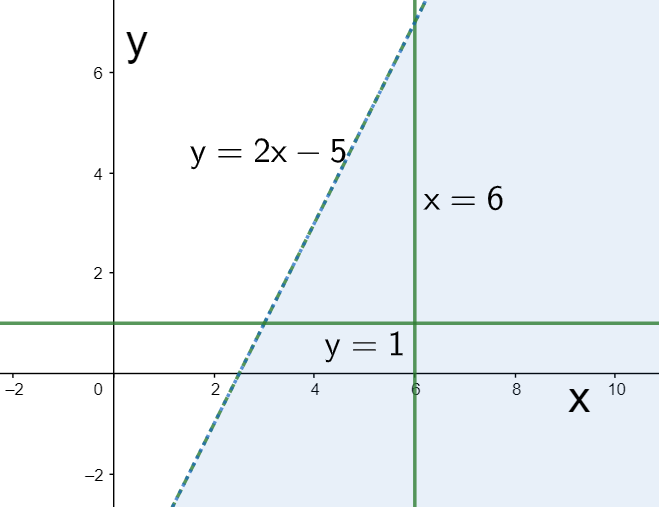
Combining the above three regions, we get the intersection region represented by the three inequalities as shown below.
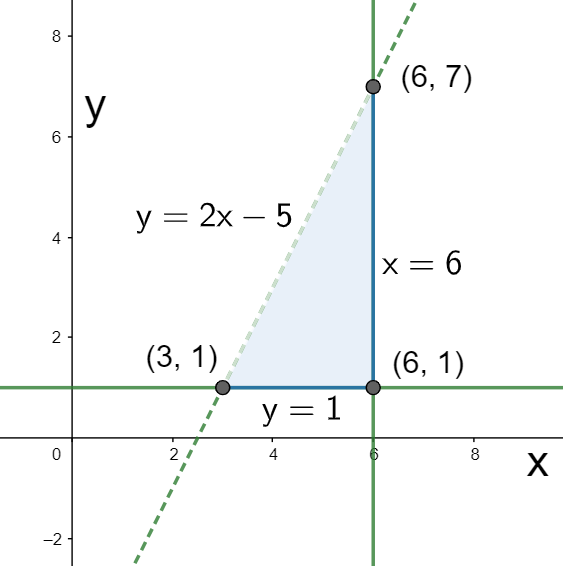
Hence, we have finally graphed the given inequalities.
Note: It is important to draw a dashed line corresponding to the inequality not involving the equal to sign under the greater than or less than symbol. For example, the third inequality $y<2x-5$ given in the question does not have an equal to sign and hence the inclined line in the above graph is dashed.
Complete step by step solution:
The inequalities given to us in the question are $y\ge 1$, $x\le 6$, and $y<2x-5$. To graph them, we first consider the corresponding equalities $y=1$, $x=6$, and $y=2x-5$. The graph of these is shown in the figure below.
Now, for representing the graph of the inequalities, we need to shade the region for each of the inequalities. Considering the first inequality, we have $y\ge 1$. This means the region above the $y=1$ will be shaded as shown below.
Now, considering the second inequality, we have $x\le 6$. This inequality will be represented by the region to the left of the line $x=6$ as shown below.
Finally, considering the third inequality, we have $y<2x-5$. On substituting $x=0,y=0$ in the inequality, we get
\[\begin{align}
& \Rightarrow 0<2\left( 0 \right)-5 \\
& \Rightarrow 0<-5 \\
\end{align}\]
The above inequality is clearly incorrect since we know that $0>-5$. This means that the origin does not satisfy the inequality $y<2x-5$, which in turn means that the region represented by this inequality will be shaded away from the origin as shown below.
Combining the above three regions, we get the intersection region represented by the three inequalities as shown below.
Hence, we have finally graphed the given inequalities.
Note: It is important to draw a dashed line corresponding to the inequality not involving the equal to sign under the greater than or less than symbol. For example, the third inequality $y<2x-5$ given in the question does not have an equal to sign and hence the inclined line in the above graph is dashed.
Recently Updated Pages
Master Class 11 Computer Science: Engaging Questions & Answers for Success
Master Class 11 Business Studies: Engaging Questions & Answers for Success
Master Class 11 Economics: Engaging Questions & Answers for Success
Master Class 11 English: Engaging Questions & Answers for Success
Master Class 11 Maths: Engaging Questions & Answers for Success
Master Class 11 Biology: Engaging Questions & Answers for Success
Trending doubts
One Metric ton is equal to kg A 10000 B 1000 C 100 class 11 physics CBSE
There are 720 permutations of the digits 1 2 3 4 5 class 11 maths CBSE
Discuss the various forms of bacteria class 11 biology CBSE
Draw a diagram of a plant cell and label at least eight class 11 biology CBSE
State the laws of reflection of light
Explain zero factorial class 11 maths CBSE