


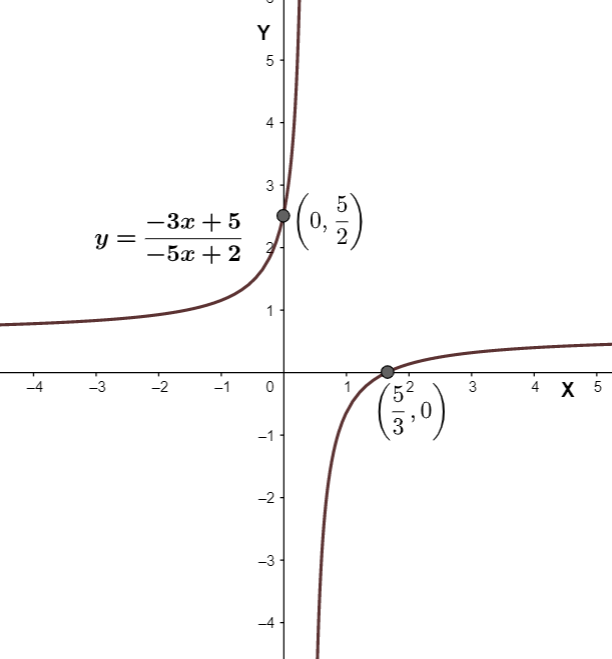
How do I graph the rational function \[y=\dfrac{-3x+5}{-5x+2}\] on a graphing calculator?
Answer
546.6k+ views
Hint: The given function is of the type \[y=\dfrac{ax+b}{cx+d}\]. We will learn how to graph such functions on the graphing calculators. Let’s take the most general graphing calculator that we used like Ti-83 or Ti-84. We will see proper steps to graph such functions in these calculators.
Complete step-by-step solution:
To draw the graph of the given equation, we will have to follow the steps given below:
Step 1: Turn on the calculators and press the key labeled as \[y=\].
Step 2: After pressing the key, the screen will show lots of spaces to type in different equations. To graph the given equation, type the expression given in the next step in the first line of the screen.
Step 3: As the line already has the “\[y=\]” part, we just have to type \[\left( -3x+5 \right)/\left( -5x+2 \right)\].
Step 4: To make the appropriate adjustments to see the graph properly, press the next key which is labeled as “windows”. Make the required adjustments for the different parameters like the minimum and maximum value of X and Y, the scale of the X and Y-axis of the graph.
Step 5: After making the required changes, press the last button in the top line labeled as “graph” to see how the actual graph looks like.
The graph will look like as follows:
Note: The keys can be labeled differently in different models of the calculator. By making the different adjustments in Step 4, we can see the graph from different views.
The graphs are very important as they decently give the information about the function as its roots, Y-intercepts, asymptote, domain, etc.
Recently Updated Pages
Master Class 11 Computer Science: Engaging Questions & Answers for Success
Master Class 11 Business Studies: Engaging Questions & Answers for Success
Master Class 11 Economics: Engaging Questions & Answers for Success
Master Class 11 English: Engaging Questions & Answers for Success
Master Class 11 Maths: Engaging Questions & Answers for Success
Master Class 11 Biology: Engaging Questions & Answers for Success
Trending doubts
One Metric ton is equal to kg A 10000 B 1000 C 100 class 11 physics CBSE
There are 720 permutations of the digits 1 2 3 4 5 class 11 maths CBSE
Discuss the various forms of bacteria class 11 biology CBSE
Draw a diagram of a plant cell and label at least eight class 11 biology CBSE
State the laws of reflection of light
Explain zero factorial class 11 maths CBSE