


How do I graph the quadratic equation \[y = - 3{x^2}\] ?
Answer
561.9k+ views
Hint: A graph of a function f is the set of ordered pairs; the equation of graph is generally represented as \[y = f(x)\], where x and f(x) are real numbers. We substitute the value of x and we determine the value of y and then we mark the points in the graph and we join the points.
Complete step-by-step answer:
Now consider the given equation \[y = - 3{x^2}\]. Here in this question, we have to plot the graph for the given function. A graph of a function is a set of ordered pairs and it is represented as \[y = f(x)\], where x and f(x) are real numbers. These pairs are in the form of cartesian form and the graph is the two-dimensional graph.
First, we have to find the value of y by using the graph equation \[y = - 3{x^2}\]. Let us substitute the value of x has -2, -1, 0, 1 and 2.
Now we consider the value of x as -2, the value of y is
\[
\Rightarrow y = - 3{( - 2)^2} \\
\Rightarrow y = - 3(4) \\
\Rightarrow y = - 12 \;
\]
Now we consider the value of x as -1, the value of y is
\[
\Rightarrow y = - 3{( - 1)^2} \\
\Rightarrow y = - 3(1) \\
\Rightarrow y = - 3 \;
\]
Now we consider the value of x as 0, the value of y is
\[
\Rightarrow y = - 3{(0)^2} \\
\Rightarrow y = 0 \;
\]
Now we consider the value of x as 1, the value of y is
\[
\Rightarrow y = - 3{(1)^2} \\
\Rightarrow y = - 3(1) \\
\Rightarrow y = - 3 \;
\]
Now we consider the value of x as 2, the value of y is
\[
\Rightarrow y = - 3{(2)^2} \\
\Rightarrow y = - 3(4) \\
\Rightarrow y = - 12 \;
\]
Now we draw a table for these values we have
The graph plotted for this point is represented below:
Note: The graph is plotted x-axis versus y axis. The graph is two dimensional. By the equation of a graph, we can plot the graph by assuming the value of x. We can’t assume the value of y. because the value of y depends on the value of x. Hence, we have plotted the graph.
Complete step-by-step answer:
Now consider the given equation \[y = - 3{x^2}\]. Here in this question, we have to plot the graph for the given function. A graph of a function is a set of ordered pairs and it is represented as \[y = f(x)\], where x and f(x) are real numbers. These pairs are in the form of cartesian form and the graph is the two-dimensional graph.
First, we have to find the value of y by using the graph equation \[y = - 3{x^2}\]. Let us substitute the value of x has -2, -1, 0, 1 and 2.
Now we consider the value of x as -2, the value of y is
\[
\Rightarrow y = - 3{( - 2)^2} \\
\Rightarrow y = - 3(4) \\
\Rightarrow y = - 12 \;
\]
Now we consider the value of x as -1, the value of y is
\[
\Rightarrow y = - 3{( - 1)^2} \\
\Rightarrow y = - 3(1) \\
\Rightarrow y = - 3 \;
\]
Now we consider the value of x as 0, the value of y is
\[
\Rightarrow y = - 3{(0)^2} \\
\Rightarrow y = 0 \;
\]
Now we consider the value of x as 1, the value of y is
\[
\Rightarrow y = - 3{(1)^2} \\
\Rightarrow y = - 3(1) \\
\Rightarrow y = - 3 \;
\]
Now we consider the value of x as 2, the value of y is
\[
\Rightarrow y = - 3{(2)^2} \\
\Rightarrow y = - 3(4) \\
\Rightarrow y = - 12 \;
\]
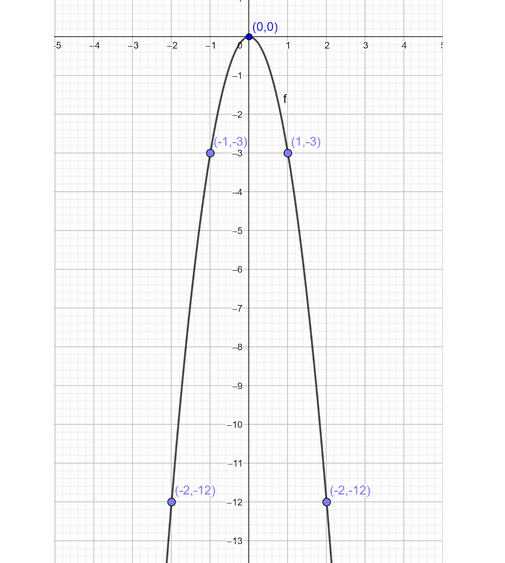
Now we draw a table for these values we have
| X | -2 | -1 | 0 | 1 | 2 |
| y | -12 | -3 | 0 | -3 | -12 |
The graph plotted for this point is represented below:
Note: The graph is plotted x-axis versus y axis. The graph is two dimensional. By the equation of a graph, we can plot the graph by assuming the value of x. We can’t assume the value of y. because the value of y depends on the value of x. Hence, we have plotted the graph.
Recently Updated Pages
Three beakers labelled as A B and C each containing 25 mL of water were taken A small amount of NaOH anhydrous CuSO4 and NaCl were added to the beakers A B and C respectively It was observed that there was an increase in the temperature of the solutions contained in beakers A and B whereas in case of beaker C the temperature of the solution falls Which one of the following statements isarecorrect i In beakers A and B exothermic process has occurred ii In beakers A and B endothermic process has occurred iii In beaker C exothermic process has occurred iv In beaker C endothermic process has occurred
Master Class 8 Social Science: Engaging Questions & Answers for Success
Master Class 8 Science: Engaging Questions & Answers for Success
Master Class 8 Maths: Engaging Questions & Answers for Success
Class 8 Question and Answer - Your Ultimate Solutions Guide
Master Class 9 Social Science: Engaging Questions & Answers for Success
Three beakers labelled as A B and C each containing 25 mL of water were taken A small amount of NaOH anhydrous CuSO4 and NaCl were added to the beakers A B and C respectively It was observed that there was an increase in the temperature of the solutions contained in beakers A and B whereas in case of beaker C the temperature of the solution falls Which one of the following statements isarecorrect i In beakers A and B exothermic process has occurred ii In beakers A and B endothermic process has occurred iii In beaker C exothermic process has occurred iv In beaker C endothermic process has occurred
Master Class 8 Social Science: Engaging Questions & Answers for Success
Master Class 8 Science: Engaging Questions & Answers for Success
Trending doubts
What is BLO What is the full form of BLO class 8 social science CBSE
Give me the opposite gender of Duck class 8 english CBSE
Citizens of India can vote at the age of A 18 years class 8 social science CBSE
Advantages and disadvantages of science
Full form of STD, ISD and PCO
What are gulf countries and why they are called Gulf class 8 social science CBSE