


How do you graph the point $\left( 1,0.75 \right)$?
Answer
560.4k+ views
Hint: In this question we are given the coordinates of a point and we have to plot the point on the graph. So for plotting the point first we will draw the axis and then mark the x coordinate and y coordinate step by step.
Complete step by step answer:
We have been given a point $\left( 1,0.75 \right)$
We have to plot the given point on the graph.
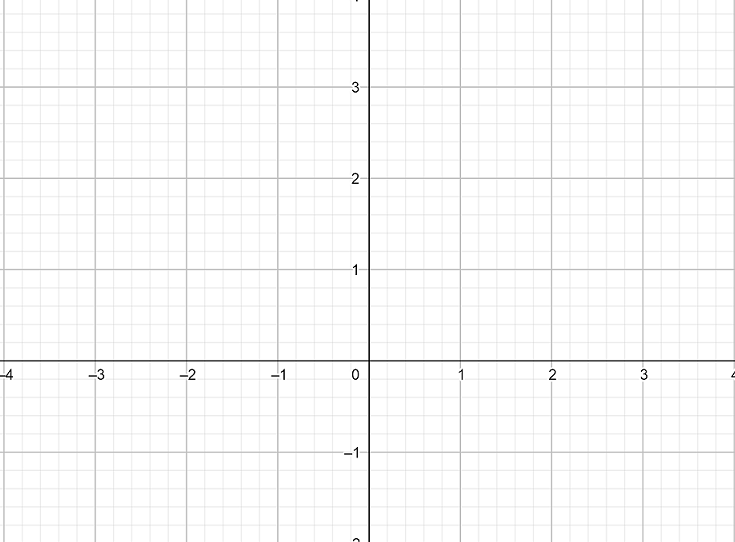
To plot a point on the graph first we need to draw an axis. Let us draw X axis and Y axis on the graph and mark the units by taking 1 unit for each box. Then we will get
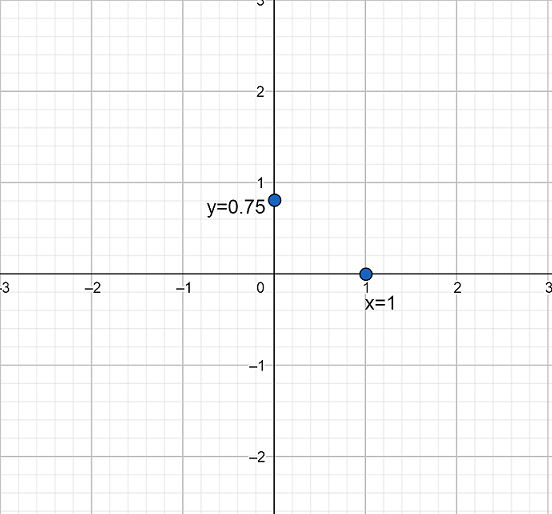
Now, we have a point $\left( 1,0.75 \right)$ in which 1 is the X-coordinate and 0.75 is the Y-coordinate and both are positive. So, first we move 1 place to the right from the origin along the X-axis and then move 0.75 to up and mark the point.
Then we will get
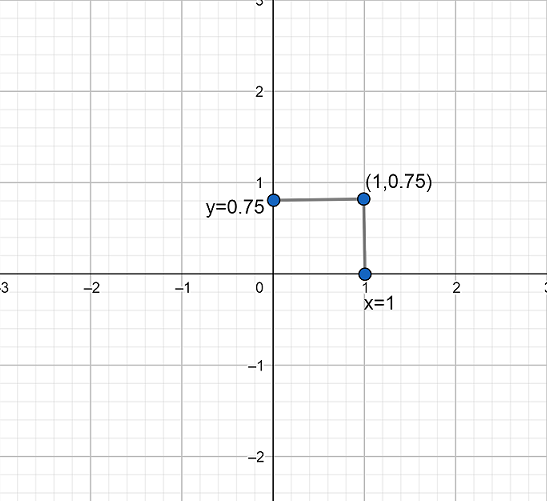
Hence we get the point $\left( 1,0.75 \right)$ on the graph.
Note:
While plotting points on the graph always check on which quadrant the point may lie. Always check the points whether they are positive or negative and draw accordingly. Right hand side from the origin the graph has positive X values and left side has negative X values. Similarly, bottom from the origin has negative Y-values and upward from the origin there is a positive Y-value. If the X-coordinate is zero then the point lies on the Y-axis and when the Y-coordinate is zero the point should lie on the X-axis.
Complete step by step answer:
We have been given a point $\left( 1,0.75 \right)$
We have to plot the given point on the graph.
To plot a point on the graph first we need to draw an axis. Let us draw X axis and Y axis on the graph and mark the units by taking 1 unit for each box. Then we will get
Now, we have a point $\left( 1,0.75 \right)$ in which 1 is the X-coordinate and 0.75 is the Y-coordinate and both are positive. So, first we move 1 place to the right from the origin along the X-axis and then move 0.75 to up and mark the point.
Then we will get
Hence we get the point $\left( 1,0.75 \right)$ on the graph.
Note:
While plotting points on the graph always check on which quadrant the point may lie. Always check the points whether they are positive or negative and draw accordingly. Right hand side from the origin the graph has positive X values and left side has negative X values. Similarly, bottom from the origin has negative Y-values and upward from the origin there is a positive Y-value. If the X-coordinate is zero then the point lies on the Y-axis and when the Y-coordinate is zero the point should lie on the X-axis.
Recently Updated Pages
Master Class 11 Computer Science: Engaging Questions & Answers for Success
Master Class 11 Business Studies: Engaging Questions & Answers for Success
Master Class 11 Economics: Engaging Questions & Answers for Success
Master Class 11 English: Engaging Questions & Answers for Success
Master Class 11 Maths: Engaging Questions & Answers for Success
Master Class 11 Biology: Engaging Questions & Answers for Success
Trending doubts
One Metric ton is equal to kg A 10000 B 1000 C 100 class 11 physics CBSE
There are 720 permutations of the digits 1 2 3 4 5 class 11 maths CBSE
Discuss the various forms of bacteria class 11 biology CBSE
Draw a diagram of a plant cell and label at least eight class 11 biology CBSE
State the laws of reflection of light
Explain zero factorial class 11 maths CBSE