


How do you graph the parabola \[y = {\left( {x - 2} \right)^2} - 3\] using vertex, intercepts and additional points?
Answer
569.1k+ views
Hint: Here in this question, we have to plot the graph of a given parabolic equation using the vertex, intercepts and additional points. To find these by comparing the given equation to the vertex form of a quadratic equation \[y = a{\left( {x - h} \right)^2} + k\] where \[\left( {h,k} \right)\] is the vertex of parabola, then the x-intercept is found by putting \[y = 0\;\] in the equation similarly y-intercept is found by putting \[x = 0\] in the equation and the additional points found by giving x values as 0, 1, 2,… to the parabolic equation we get simultaneously the y values.
Complete step-by-step answer:
Consider the equation of parabola
\[y = {\left( {x - 2} \right)^2} - 3\]
Compare to this equation with the vertex form of a quadratic equation is given by \[y = a{\left( {x - h} \right)^2} + k\] where \[\left( {h,k} \right)\] is the vertex of the parabola. The h represents the horizontal shift and k represents the vertical shift.
Here \[h = 2\], \[k = - 3\], \[a = 1\] Since \[a\] is positive, the parabola opens upward.
Therefore, the vertex of parabola \[V\left( {h,k} \right) = V\left( {2, - 3} \right)\]
The Axis of symmetry is \[x = h\] or \[x = 2\].
The y-intercept is found by putting \[x = 0\] in the equation i.e.,
\[ \Rightarrow y = {\left( {0 - 2} \right)^2} - 3\]
\[ \Rightarrow y = 4 - 3\]
\[ \Rightarrow y = 1\]
Hence, the parabola intersects the y-axis at \[\left( {0,1} \right)\]
Similarly, the x-intercept is found by putting \[y = 0\] in the equation i.e.,
\[ \Rightarrow 0 = {\left( {x - 2} \right)^2} - 3\]
On rearranging
\[ \Rightarrow {\left( {x - 2} \right)^2} = 3\]
On simplification, we het
\[ \Rightarrow x - 2 = \pm \sqrt 3 \]
\[ \Rightarrow x = 2 \pm \sqrt 3 \]
\[ \Rightarrow x = 2 + \sqrt 3 \] and \[x = 2 - \sqrt 3 \]
\[ \Rightarrow x \cong 3.732\] and \[x \cong 0.268\]
Hence, the parabola intersects the x-axis at \[\left( {3.732,0} \right)\] and \[\,\left( {0.268,0} \right)\]
Now find the additional points by giving the x values as 0, 1, 2,… to the parabolic equation we get simultaneously the y values.
The additional points are:
The graph of parabola \[y = {\left( {x - 2} \right)^2} - 3\] is:
Note: When we see the equation we can easily recognize the kind of graph we can obtain. Usually the equation will be in the form of \[y = a{\left( {x - h} \right)^2} + k\]. Hence by substituting the value of x we can determine the value of y. The graph is plotted x-axis versus y-axis. The graph is of the form 2D
Complete step-by-step answer:
Consider the equation of parabola
\[y = {\left( {x - 2} \right)^2} - 3\]
Compare to this equation with the vertex form of a quadratic equation is given by \[y = a{\left( {x - h} \right)^2} + k\] where \[\left( {h,k} \right)\] is the vertex of the parabola. The h represents the horizontal shift and k represents the vertical shift.
Here \[h = 2\], \[k = - 3\], \[a = 1\] Since \[a\] is positive, the parabola opens upward.
Therefore, the vertex of parabola \[V\left( {h,k} \right) = V\left( {2, - 3} \right)\]
The Axis of symmetry is \[x = h\] or \[x = 2\].
The y-intercept is found by putting \[x = 0\] in the equation i.e.,
\[ \Rightarrow y = {\left( {0 - 2} \right)^2} - 3\]
\[ \Rightarrow y = 4 - 3\]
\[ \Rightarrow y = 1\]
Hence, the parabola intersects the y-axis at \[\left( {0,1} \right)\]
Similarly, the x-intercept is found by putting \[y = 0\] in the equation i.e.,
\[ \Rightarrow 0 = {\left( {x - 2} \right)^2} - 3\]
On rearranging
\[ \Rightarrow {\left( {x - 2} \right)^2} = 3\]
On simplification, we het
\[ \Rightarrow x - 2 = \pm \sqrt 3 \]
\[ \Rightarrow x = 2 \pm \sqrt 3 \]
\[ \Rightarrow x = 2 + \sqrt 3 \] and \[x = 2 - \sqrt 3 \]
\[ \Rightarrow x \cong 3.732\] and \[x \cong 0.268\]
Hence, the parabola intersects the x-axis at \[\left( {3.732,0} \right)\] and \[\,\left( {0.268,0} \right)\]
Now find the additional points by giving the x values as 0, 1, 2,… to the parabolic equation we get simultaneously the y values.
The additional points are:
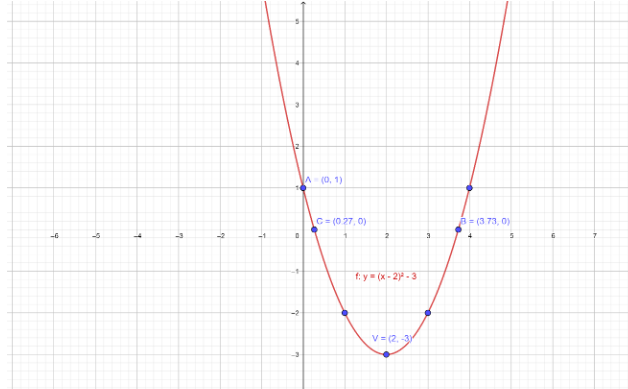
| \[x\] | \[0\] | \[1\] | \[2\] | \[3\] | \[4\] |
| \[y = {\left( {x - 2} \right)^2} - 3\] | \[1\] | \[ - 2\] | \[ - 3\] | \[ - 2\] | \[1\] |
| \[\left( {x,y} \right)\] | \[\left( {0,1} \right)\] | \[\left( {1, - 2} \right)\] | \[\left( {2, - 3} \right)\] | \[\left( {3, - 2} \right)\] | \[\left( {4,1} \right)\] |
The graph of parabola \[y = {\left( {x - 2} \right)^2} - 3\] is:
Note: When we see the equation we can easily recognize the kind of graph we can obtain. Usually the equation will be in the form of \[y = a{\left( {x - h} \right)^2} + k\]. Hence by substituting the value of x we can determine the value of y. The graph is plotted x-axis versus y-axis. The graph is of the form 2D

Recently Updated Pages
Master Class 11 English: Engaging Questions & Answers for Success
Master Class 11 Maths: Engaging Questions & Answers for Success
Class 11 Question and Answer - Your Ultimate Solutions Guide
Master Class 11 Biology: Engaging Questions & Answers for Success
Master Class 11 Physics: Engaging Questions & Answers for Success
Master Class 11 Accountancy: Engaging Questions & Answers for Success
Trending doubts
What is BLO What is the full form of BLO class 8 social science CBSE
What are the 12 elements of nature class 8 chemistry CBSE
Citizens of India can vote at the age of A 18 years class 8 social science CBSE
Name the states through which the Tropic of Cancer class 8 social science CBSE
Right to vote is a AFundamental Right BFundamental class 8 social science CBSE
Advantages and disadvantages of science