


How do you graph the parabola \[y = {\left( {x + 4} \right)^2} + 2\] using vertex, intercepts and additional points?
Answer
561.9k+ views
Hint: Here in this question, we have to plot the graph of a given parabolic equation using the vertex, intercepts and additional points. To find these by comparing the given equation to the vertex form of a quadratic equation \[y = a{\left( {x - h} \right)^2} + k\] where \[\left( {h,k} \right)\] is the vertex of parabola, then the x-intercept is found by putting \[y = 0\;\] in the equation similarly y-intercept is found by putting \[x = 0\] in the equation and the additional points found by giving x values as 0, 1, 2,… to the parabolic equation we get simultaneously the y values.
Complete step-by-step answer:
Consider the equation of parabola
\[y = {\left( {x + 4} \right)^2} + 2\]
Compare to this equation with the vertex form of a quadratic equation is given by \[y = a{\left( {x - h} \right)^2} + k\] where \[\left( {h,k} \right)\] is the vertex of the parabola. The h represents the horizontal shift and k represents the vertical shift.
Here \[h = - 4\], \[k = 2\], \[a = 1\] Since \[a\] is positive, the parabola opens upward.
Therefore, the vertex of parabola \[V\left( {h,k} \right) = V\left( { - 4,2} \right)\]
The Axis of symmetry is \[x = h\] or \[x = - 4\].
Since, the parabola is upward & above x-axis hence it wouldn't intersect the x-axis. Now, to find y-intercept we set \[x = 0\] in given equation, as follows i.e.,
\[ \Rightarrow y = {(0 + 4)^2} + 2\]
\[ \Rightarrow y = 16 + 2\]
\[ \Rightarrow y = 8\]
Hence, the parabola intersects the y-axis at \[\left( {0,18} \right)\]
Now find the additional points by giving the x values as 0, 1, 2,… to the parabolic equation we get simultaneously the y values.
The additional points are:
The graph of parabola \[y = {\left( {x + 4} \right)^2} + 2\] is:
Note: When we see the equation we can easily recognize the kind of graph we can obtain. Usually the equation will be in the form of \[y = a{\left( {x - h} \right)^2} + k\]. Hence by substituting the value of x we can determine the value of y. The graph is plotted x-axis versus y-axis. The graph is of the form 2D.
Complete step-by-step answer:
Consider the equation of parabola
\[y = {\left( {x + 4} \right)^2} + 2\]
Compare to this equation with the vertex form of a quadratic equation is given by \[y = a{\left( {x - h} \right)^2} + k\] where \[\left( {h,k} \right)\] is the vertex of the parabola. The h represents the horizontal shift and k represents the vertical shift.
Here \[h = - 4\], \[k = 2\], \[a = 1\] Since \[a\] is positive, the parabola opens upward.
Therefore, the vertex of parabola \[V\left( {h,k} \right) = V\left( { - 4,2} \right)\]
The Axis of symmetry is \[x = h\] or \[x = - 4\].
Since, the parabola is upward & above x-axis hence it wouldn't intersect the x-axis. Now, to find y-intercept we set \[x = 0\] in given equation, as follows i.e.,
\[ \Rightarrow y = {(0 + 4)^2} + 2\]
\[ \Rightarrow y = 16 + 2\]
\[ \Rightarrow y = 8\]
Hence, the parabola intersects the y-axis at \[\left( {0,18} \right)\]
Now find the additional points by giving the x values as 0, 1, 2,… to the parabolic equation we get simultaneously the y values.
The additional points are:
| \[x\] | \[ - 6\] | \[ - 5\] | \[ - 4\] | \[ - 3\] | \[ - 2\] |
| \[y = {\left( {x + 4} \right)^2} + 2\] | \[6\] | \[3\] | \[2\] | \[3\] | \[6\] |
| \[\left( {x,y} \right)\] | \[\left( { - 6,6} \right)\] | \[\left( { - 5,3} \right)\] | \[\left( { - 4,2} \right)\] | \[\left( { - 3,3} \right)\] | \[\left( { - 2,6} \right)\] |
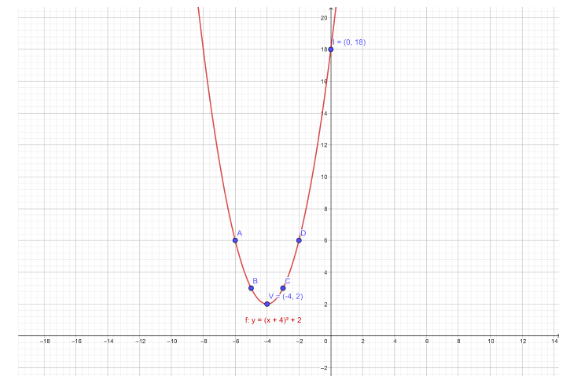
The graph of parabola \[y = {\left( {x + 4} \right)^2} + 2\] is:
Note: When we see the equation we can easily recognize the kind of graph we can obtain. Usually the equation will be in the form of \[y = a{\left( {x - h} \right)^2} + k\]. Hence by substituting the value of x we can determine the value of y. The graph is plotted x-axis versus y-axis. The graph is of the form 2D.

Recently Updated Pages
Master Class 8 Social Science: Engaging Questions & Answers for Success
Master Class 8 Science: Engaging Questions & Answers for Success
Master Class 8 Maths: Engaging Questions & Answers for Success
Class 8 Question and Answer - Your Ultimate Solutions Guide
Master Class 9 Social Science: Engaging Questions & Answers for Success
Master Class 9 Science: Engaging Questions & Answers for Success
Trending doubts
What are gulf countries and why they are called Gulf class 8 social science CBSE
What is BLO What is the full form of BLO class 8 social science CBSE
Give full form of LPG and CNG class 8 chemistry CBSE
Citizens of India can vote at the age of A 18 years class 8 social science CBSE
Advantages and disadvantages of science
Give me the opposite gender of Duck class 8 english CBSE