


How do you graph the parabola $y = {\left( {x + 3} \right)^2} - 2$ using vertex, intercepts and additional points?
Answer
607.5k+ views
Hint: The given equation in the vertex form, hence we can easily find the vertex from the equation which is given as $\left( {h,k} \right) = \left( { - 3, - 2} \right)$. Once we have found the vertex, we then move on to find the x-intercept and the y-intercept. After that we find the additional points by taking any value of $x$ and finding the subsequent value for $y$ using the given expression. Then we plot these points on the graph to get our required parabola.
Complete Step by Step Solution:
In this question, the equation is given in the vertex form as $y = {\left( {x + 3} \right)^2} - 2$.
We know that the vertex form is expressed as $y = a{\left( {x - h} \right)^2} + k$
Therefore, the vertex here is given as $\left( {h,k} \right) = \left( { - 3, - 2} \right)$
Since $a > 0$, therefore the parabola will be like a smile, that is it will be upside down.
The vertex presents the lowest point of the parabola.
Now, we find the intercepts, that is the point at which the parabola cuts the x-axis and the y-axis
In order to find the y- intercept, let $x = 0$
Given equation: $y = {\left( {x + 3} \right)^2} - 2$
$ \Rightarrow y = {\left( {0 + 3} \right)^2} - 2$
On simplifying, we get:
$ \Rightarrow y = 9 - 2 = 7$
Therefore y-intercept is $\left( {0,7} \right)$
Let us find the x-intercept now. In order to find x-intercept, we need to put $y = 0$
Given equation: $y = {\left( {x + 3} \right)^2} - 2$
$ \Rightarrow {\left( {x + 3} \right)^2} - 2 = 0$
On adding $ + 2$ to both sides, we get:
$ \Rightarrow {\left( {x + 3} \right)^2} = 2$
Taking square roots on both sides, we get:
$ \Rightarrow x + 3 = \pm \sqrt 2 $
$ \Rightarrow x = \pm \sqrt 2 - 3$
$x = + \sqrt 2 - 3$ or $x = - \sqrt 2 - 3$
As we know that $\sqrt 2 = 1.414$
Therefore, $x = 1.41 - 3$ or $x = - 1.41 - 3$
$ \Rightarrow x = - 1.59$ or $x = - 4.41$
Thus, the coordinates of x-intercept can be either $\left( { - 1.59,0} \right)$ or $\left( { - 4.41,0} \right)$
Now let us find a few additional points to plot in our parabola:
Let $x = - 1$
Therefore, $y = {\left( {x + 3} \right)^2} - 2$
$ \Rightarrow y = {\left( { - 1 + 3} \right)^2} - 2$
$ \Rightarrow y = 4 - 2 = 2$
Additional coordinate E = $\left( { - 1,2} \right)$
Let $x = - 5$
$ \Rightarrow y = {\left( {x + 3} \right)^2} - 2$
$ \Rightarrow y = {\left( { - 5 + 3} \right)^2} - 2$
$ \Rightarrow y = 4 - 2 = 2$
Additional coordinate F= $\left( { - 5,2} \right)$
Let us plot these points in the graph:
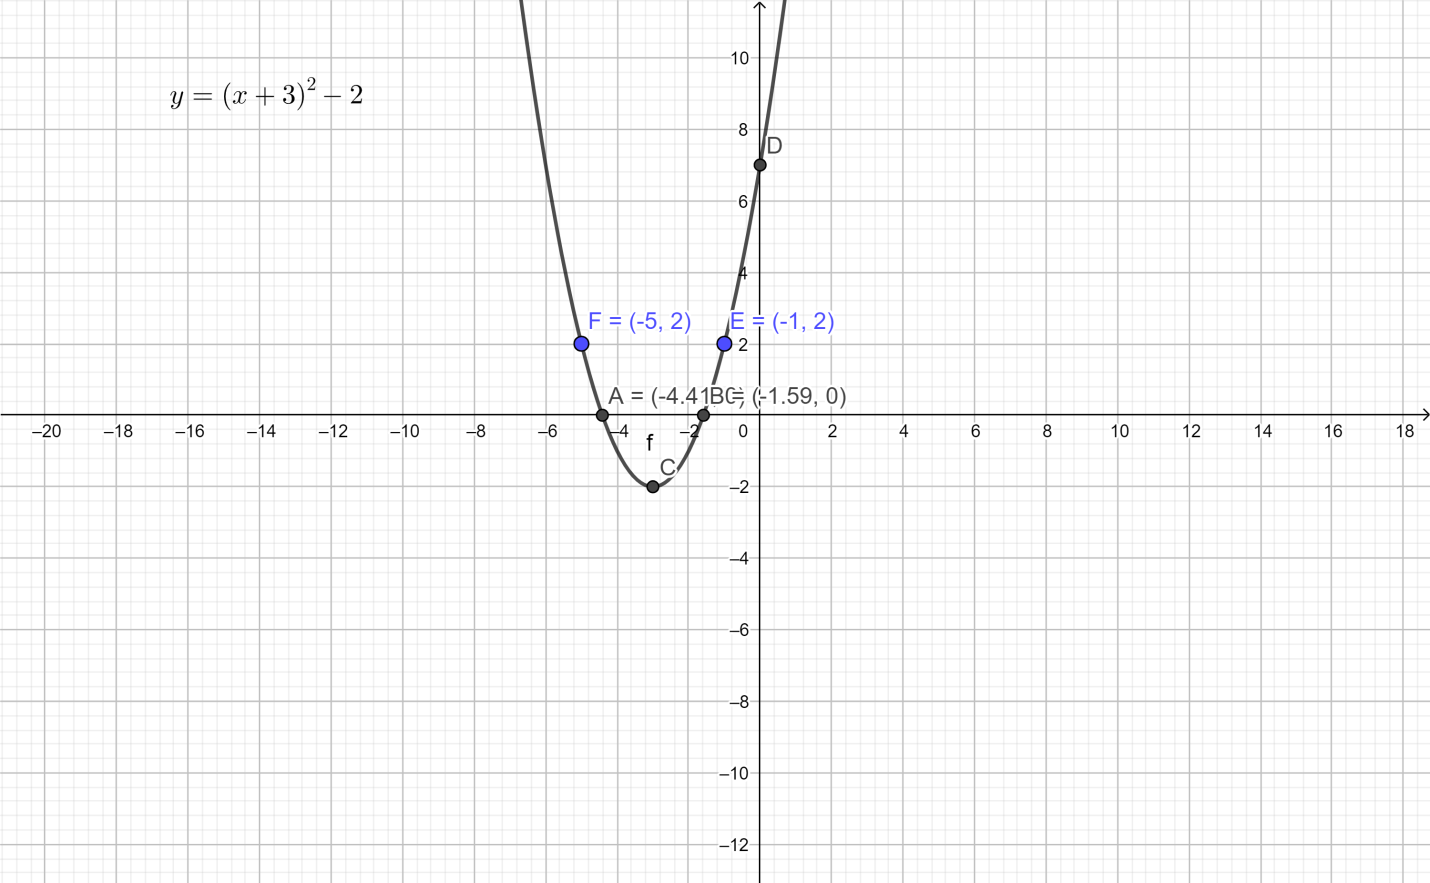
In the graph shown above:
Point C is the vertex
Point D represents the y-intercept
Point $A\left( { - 4.41,0} \right)$ And Point $B\left( { - 1.59,0} \right)$ represent the x-intercept.
Point E and F represent the additional points.
Note: The graph of a quadratic function is a parabola. The vertex is nothing but the highest or lowest point of a parabola, depending if it's downward shaped or upward shaped respectively. The shape of the parabola is determined by the coefficient $a$ of the quadratic function.
If $a > 0$, then the graph makes a smile, which means it is an upward graph.
If $a < 0$, then the graph makes a frown, which means it is a downward graph.
Complete Step by Step Solution:
In this question, the equation is given in the vertex form as $y = {\left( {x + 3} \right)^2} - 2$.
We know that the vertex form is expressed as $y = a{\left( {x - h} \right)^2} + k$
Therefore, the vertex here is given as $\left( {h,k} \right) = \left( { - 3, - 2} \right)$
Since $a > 0$, therefore the parabola will be like a smile, that is it will be upside down.
The vertex presents the lowest point of the parabola.
Now, we find the intercepts, that is the point at which the parabola cuts the x-axis and the y-axis
In order to find the y- intercept, let $x = 0$
Given equation: $y = {\left( {x + 3} \right)^2} - 2$
$ \Rightarrow y = {\left( {0 + 3} \right)^2} - 2$
On simplifying, we get:
$ \Rightarrow y = 9 - 2 = 7$
Therefore y-intercept is $\left( {0,7} \right)$
Let us find the x-intercept now. In order to find x-intercept, we need to put $y = 0$
Given equation: $y = {\left( {x + 3} \right)^2} - 2$
$ \Rightarrow {\left( {x + 3} \right)^2} - 2 = 0$
On adding $ + 2$ to both sides, we get:
$ \Rightarrow {\left( {x + 3} \right)^2} = 2$
Taking square roots on both sides, we get:
$ \Rightarrow x + 3 = \pm \sqrt 2 $
$ \Rightarrow x = \pm \sqrt 2 - 3$
$x = + \sqrt 2 - 3$ or $x = - \sqrt 2 - 3$
As we know that $\sqrt 2 = 1.414$
Therefore, $x = 1.41 - 3$ or $x = - 1.41 - 3$
$ \Rightarrow x = - 1.59$ or $x = - 4.41$
Thus, the coordinates of x-intercept can be either $\left( { - 1.59,0} \right)$ or $\left( { - 4.41,0} \right)$
Now let us find a few additional points to plot in our parabola:
Let $x = - 1$
Therefore, $y = {\left( {x + 3} \right)^2} - 2$
$ \Rightarrow y = {\left( { - 1 + 3} \right)^2} - 2$
$ \Rightarrow y = 4 - 2 = 2$
Additional coordinate E = $\left( { - 1,2} \right)$
Let $x = - 5$
$ \Rightarrow y = {\left( {x + 3} \right)^2} - 2$
$ \Rightarrow y = {\left( { - 5 + 3} \right)^2} - 2$
$ \Rightarrow y = 4 - 2 = 2$
Additional coordinate F= $\left( { - 5,2} \right)$
Let us plot these points in the graph:
In the graph shown above:
Point C is the vertex
Point D represents the y-intercept
Point $A\left( { - 4.41,0} \right)$ And Point $B\left( { - 1.59,0} \right)$ represent the x-intercept.
Point E and F represent the additional points.
Note: The graph of a quadratic function is a parabola. The vertex is nothing but the highest or lowest point of a parabola, depending if it's downward shaped or upward shaped respectively. The shape of the parabola is determined by the coefficient $a$ of the quadratic function.
If $a > 0$, then the graph makes a smile, which means it is an upward graph.
If $a < 0$, then the graph makes a frown, which means it is a downward graph.
Recently Updated Pages
Master Class 11 English: Engaging Questions & Answers for Success
Master Class 11 Physics: Engaging Questions & Answers for Success
Master Class 11 Computer Science: Engaging Questions & Answers for Success
Master Class 11 Chemistry: Engaging Questions & Answers for Success
Master Class 11 Social Science: Engaging Questions & Answers for Success
Master Class 11 Accountancy: Engaging Questions & Answers for Success
Trending doubts
Draw a diagram of a plant cell and label at least eight class 11 biology CBSE
Proton was discovered by A Thomson B Rutherford C Chadwick class 11 chemistry CBSE
What is the purity of pure gold in carat class 11 chemistry CBSE
Can anyone list 10 advantages and disadvantages of friction
Lysosomes are known as suicidal bags of cell why class 11 biology CBSE
Derive the equation of motion by the calculus method class 11 physics CBSE