


How do you graph the linear system and tell how many solutions it has for $x+y=1$ and $2x-3y=12$?
Answer
555k+ views
Hint: Arrange both the equation in ‘y’ terms to draw tables by considering different ‘x’ and ‘y’ values. Plot the graph by taking values from the table. From the graph find the intersection point of two equations. That is the required solution.
Complete step by step answer:
For solving equations by graphing, we have to draw the graphs of both the equations and find the intersection point of both the graphs.
Considering the equations
$x+y=1$
it can be written as
$\Rightarrow y=1-x$………(1)
$2x-3y=12$
which can be written as
$\Rightarrow 3y=2x-12$
$\Rightarrow y=\dfrac{2}{3}x-4$………..(2)
From equation (1) and (2) we can make two tables considering different values of ‘x’ and ‘y’.
Table-1:
Table-2:
The graph can be drawn by plotting these values as
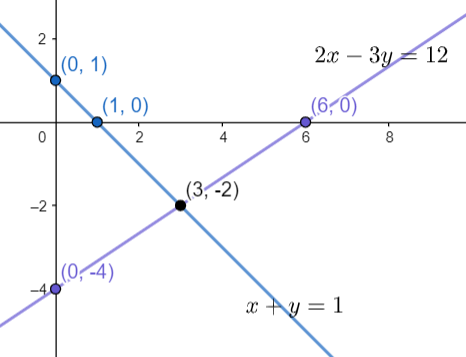
From the above graph we can conclude that the two equations $x+y=1$ and $2x-3y=12$ are passing through a common point on the graph i.e. $\left( 3,-2 \right)$
So, the equations has only one solution, that is $\left( x,y \right)=\left( 3,-2 \right)$.
Note: Equations should be arranged in ‘y’ terms so that we can get different ‘y’ values by taking random ’x’ values and vice-versa. Two different tables should be created for two different equations using those values of ‘x’ and ‘y’. Graphs should be drawn by plotting the corresponding ‘x’ and ‘y’ values from the table created. The intersection point on the graph is the solution of the equations where it’s x-coordinate is the ‘x’ value and y-coordinate is the ‘y’ value.
Complete step by step answer:
For solving equations by graphing, we have to draw the graphs of both the equations and find the intersection point of both the graphs.
Considering the equations
$x+y=1$
it can be written as
$\Rightarrow y=1-x$………(1)
$2x-3y=12$
which can be written as
$\Rightarrow 3y=2x-12$
$\Rightarrow y=\dfrac{2}{3}x-4$………..(2)
From equation (1) and (2) we can make two tables considering different values of ‘x’ and ‘y’.
Table-1:
| x | 0 | 1 |
| y | 1 | 0 |
Table-2:
| x | 0 | 6 |
| y | $-4$ | 0 |
The graph can be drawn by plotting these values as
From the above graph we can conclude that the two equations $x+y=1$ and $2x-3y=12$ are passing through a common point on the graph i.e. $\left( 3,-2 \right)$
So, the equations has only one solution, that is $\left( x,y \right)=\left( 3,-2 \right)$.
Note: Equations should be arranged in ‘y’ terms so that we can get different ‘y’ values by taking random ’x’ values and vice-versa. Two different tables should be created for two different equations using those values of ‘x’ and ‘y’. Graphs should be drawn by plotting the corresponding ‘x’ and ‘y’ values from the table created. The intersection point on the graph is the solution of the equations where it’s x-coordinate is the ‘x’ value and y-coordinate is the ‘y’ value.

Recently Updated Pages
Master Class 9 General Knowledge: Engaging Questions & Answers for Success
Master Class 9 Social Science: Engaging Questions & Answers for Success
Master Class 9 English: Engaging Questions & Answers for Success
Master Class 9 Maths: Engaging Questions & Answers for Success
Master Class 9 Science: Engaging Questions & Answers for Success
Class 9 Question and Answer - Your Ultimate Solutions Guide
Trending doubts
Difference Between Plant Cell and Animal Cell
Fill the blanks with the suitable prepositions 1 The class 9 english CBSE
Who is eligible for RTE class 9 social science CBSE
Which places in India experience sunrise first and class 9 social science CBSE
What is pollution? How many types of pollution? Define it
Name 10 Living and Non living things class 9 biology CBSE