


How do you graph the linear equation $3x + y = 15$?
Answer
572.7k+ views
Hint: In this question, we need to plot a graph of the given linear equation. Note that the given equation is a linear equation. To plot the graph, we find the intercepts, so we set one variable to zero and obtain the other variable and vice versa. Firstly, to obtain the $x$-intercept, we set the value of y equal to zero and find the point. Then, to obtain the $y$-intercept, we set the value of x equal to zero and find the point. Then from obtained $(x,y)$ points we plot a graph of the given equation in the x-y plane.
Complete step-by-step solution:
Given an equation of the form $3x + y = 15$ …… (1)
We are asked to draw the graph of the above equation.
Note that the given equation is one of the equations of a straight line. We know this fact because both x and y terms in the equation are of power 1 (so they are not squared or square rooted terms).
We can simplify the given equation, so that our calculation becomes easier.
We draw the graph by finding $x$-intercept and $y$-intercept.
So we find the points of intercepts and then draw a line through them.
Finding the $x$-intercept :
The line crosses the x-axis at $y = 0$.
Taking $y = 0$ in the equation (1) we get,
$ \Rightarrow 3x + 0 = 15$
This can be written as,
$ \Rightarrow 3x = 15$
Dividing throughout by 3, we get,
$ \Rightarrow \dfrac{{3x}}{3} = \dfrac{{15}}{3}$
$ \Rightarrow x = 5$
So the point is $(5,0)$.
Finding the $y$-intercept :
The line crosses the y-axis at $x = 0$.
Taking $x = 0$ in the equation (1) we get,
$ \Rightarrow 3(0) + y = 15$
This can be written as,
$ \Rightarrow 0 + y = 15$
$ \Rightarrow y = 15$
So the point is $(0,15)$.
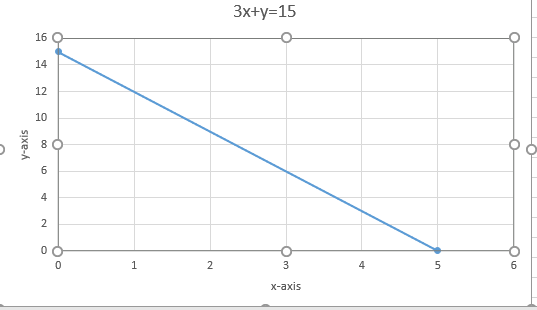
Hence the $x$-intercept is $(5,0)$ and the $y$-intercept is $(0,15)$.
Now we plot the graph for the obtained points.
Note that the graph is a straight line.
Note: We can also plot the graph of the linear equation by using slope and intercept form.
Students must remember that to obtain the $x$-intercept, we set the value of y equal to zero and find the point. Then, to obtain the $y$-intercept, we set the value of x equal to zero and find the point. Then from obtained $(x,y)$points we plot a graph of the given equation in the x-y plane.
Linear graphs have many applications. In our day-to-day life, we observe variation in the value of different quantities depending upon the variation in values of other quantities.
For example, if the number of persons visiting a cloth shop increases, then the earning of the shop also increases and vice versa.
Another example, if a number of people are employed, then the time taken to accomplish a job decreases.
We generally represent this with the help of linear graphs.
Complete step-by-step solution:
Given an equation of the form $3x + y = 15$ …… (1)
We are asked to draw the graph of the above equation.
Note that the given equation is one of the equations of a straight line. We know this fact because both x and y terms in the equation are of power 1 (so they are not squared or square rooted terms).
We can simplify the given equation, so that our calculation becomes easier.
We draw the graph by finding $x$-intercept and $y$-intercept.
So we find the points of intercepts and then draw a line through them.
Finding the $x$-intercept :
The line crosses the x-axis at $y = 0$.
Taking $y = 0$ in the equation (1) we get,
$ \Rightarrow 3x + 0 = 15$
This can be written as,
$ \Rightarrow 3x = 15$
Dividing throughout by 3, we get,
$ \Rightarrow \dfrac{{3x}}{3} = \dfrac{{15}}{3}$
$ \Rightarrow x = 5$
So the point is $(5,0)$.
Finding the $y$-intercept :
The line crosses the y-axis at $x = 0$.
Taking $x = 0$ in the equation (1) we get,
$ \Rightarrow 3(0) + y = 15$
This can be written as,
$ \Rightarrow 0 + y = 15$
$ \Rightarrow y = 15$
So the point is $(0,15)$.
Hence the $x$-intercept is $(5,0)$ and the $y$-intercept is $(0,15)$.
Now we plot the graph for the obtained points.
Note that the graph is a straight line.
Note: We can also plot the graph of the linear equation by using slope and intercept form.
Students must remember that to obtain the $x$-intercept, we set the value of y equal to zero and find the point. Then, to obtain the $y$-intercept, we set the value of x equal to zero and find the point. Then from obtained $(x,y)$points we plot a graph of the given equation in the x-y plane.
Linear graphs have many applications. In our day-to-day life, we observe variation in the value of different quantities depending upon the variation in values of other quantities.
For example, if the number of persons visiting a cloth shop increases, then the earning of the shop also increases and vice versa.
Another example, if a number of people are employed, then the time taken to accomplish a job decreases.
We generally represent this with the help of linear graphs.
Recently Updated Pages
Master Class 12 Business Studies: Engaging Questions & Answers for Success
Master Class 12 Biology: Engaging Questions & Answers for Success
Master Class 12 Chemistry: Engaging Questions & Answers for Success
Class 12 Question and Answer - Your Ultimate Solutions Guide
Master Class 11 Social Science: Engaging Questions & Answers for Success
Master Class 11 English: Engaging Questions & Answers for Success
Trending doubts
Explain the Treaty of Vienna of 1815 class 10 social science CBSE
Who Won 36 Oscar Awards? Record Holder Revealed
What is the median of the first 10 natural numbers class 10 maths CBSE
Why is it 530 pm in india when it is 1200 afternoon class 10 social science CBSE
The highest temperature in Karnataka is recorded in class 10 social science CBSE
Define Potential, Developed, Stock and Reserved resources