


How do you graph the line $ y = \dfrac{x}{3} + 1 $ ?
Answer
544.2k+ views
Hint: A graph of a function f is the set of ordered pairs; the equation of graph is generally represented as $ y = f\left( x \right) $ , where x and f(x) are real numbers. We substitute the value of x and we determine the value of y and then we mark the points in the graph and we join the points.
Complete step by step solution:
Here in this question, we have to plot the graph for the given function. A graph of a function is set of ordered pairs and it is represented as $ y = f\left( x \right) $ , where x and f(x) are real numbers. These pairs are in the form of cartesian form and the graph is the two-dimensional graph.
First, we have to find the value of y by using the graph equation $ y = \dfrac{x}{3} + 1 $ . Let we substitute the value of x as $ 0 $ , $ - 3 $ , and $ 3 $ .
Now we consider the value of x as $ 0 $ , the value of y is
$ \Rightarrow y = \dfrac{0}{3} + 1 $
$ \Rightarrow y = 1 $
Now we consider the value of x as $ - 3 $ , the value of y is
$ \Rightarrow y = \dfrac{{ - 3}}{3} + 1 $
$ \Rightarrow y = - 1 + 1 $
$ \Rightarrow y = 0 $
Now we consider the value of x as $ 3 $ , the value of y is
$ \Rightarrow y = \dfrac{3}{3} + 1 $
$ \Rightarrow y = 2 $
Now we draw a table for these values we have
The graph plotted for these point is represented below:
Note: The graph plotted is of two dimensional. The graph is plotted in x-axis versus y axis. By the equation of a graph, we can plot the graph by assuming the value of x. We can’t assume the value of y because the value of y depends on the value of x.
Complete step by step solution:
Here in this question, we have to plot the graph for the given function. A graph of a function is set of ordered pairs and it is represented as $ y = f\left( x \right) $ , where x and f(x) are real numbers. These pairs are in the form of cartesian form and the graph is the two-dimensional graph.
First, we have to find the value of y by using the graph equation $ y = \dfrac{x}{3} + 1 $ . Let we substitute the value of x as $ 0 $ , $ - 3 $ , and $ 3 $ .
Now we consider the value of x as $ 0 $ , the value of y is
$ \Rightarrow y = \dfrac{0}{3} + 1 $
$ \Rightarrow y = 1 $
Now we consider the value of x as $ - 3 $ , the value of y is
$ \Rightarrow y = \dfrac{{ - 3}}{3} + 1 $
$ \Rightarrow y = - 1 + 1 $
$ \Rightarrow y = 0 $
Now we consider the value of x as $ 3 $ , the value of y is
$ \Rightarrow y = \dfrac{3}{3} + 1 $
$ \Rightarrow y = 2 $
Now we draw a table for these values we have
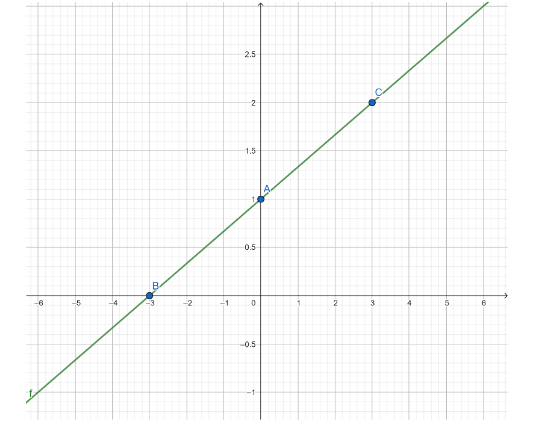
| x | $ 0 $ | $ - 3 $ | $ 3 $ |
| y | $ 1 $ | $ 0 $ | $ 2 $ |
The graph plotted for these point is represented below:
Note: The graph plotted is of two dimensional. The graph is plotted in x-axis versus y axis. By the equation of a graph, we can plot the graph by assuming the value of x. We can’t assume the value of y because the value of y depends on the value of x.

Recently Updated Pages
Master Class 8 Social Science: Engaging Questions & Answers for Success
Master Class 8 English: Engaging Questions & Answers for Success
Class 8 Question and Answer - Your Ultimate Solutions Guide
Master Class 8 Maths: Engaging Questions & Answers for Success
Master Class 8 Science: Engaging Questions & Answers for Success
Master Class 7 English: Engaging Questions & Answers for Success
Trending doubts
What is BLO What is the full form of BLO class 8 social science CBSE
Citizens of India can vote at the age of A 18 years class 8 social science CBSE
Full form of STD, ISD and PCO
Convert 40circ C to Fahrenheit A 104circ F B 107circ class 8 maths CBSE
Advantages and disadvantages of science
Right to vote is a AFundamental Right BFundamental class 8 social science CBSE