


How do you graph the line $ y = 6x - 3 $ by plotting points?
Answer
587.4k+ views
Hint: A graph of a function f is the set of ordered pairs; the equation of graph is generally represented as $ y = f\left( x \right) $ , where x and f(x) are real numbers. We substitute the value of x and we determine the value of y and then we mark the points in the graph and we join the points.
Complete step-by-step answer:
Here in this question, we have to plot the graph for the given function. A graph of a function is a set of ordered pairs and it is represented as $ y = f\left( x \right) $ , where x and f(x) are real numbers. These pairs are in the form of cartesian form and the graph is the two-dimensional graph.
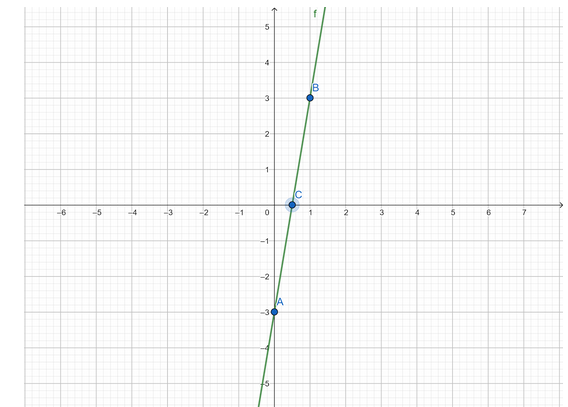
First, we have to find the value of y by using the graph equation $ y = 6x - 3 $ . Let we substitute the value of x as $ 0 $ , $ 1 $ , and $ \dfrac{1}{2} $ .
Now we consider the value of x as $ 0 $ , the value of y is
$ \Rightarrow y = 6\left( 0 \right) - 3 $
$ \Rightarrow y = - 3 $
Now we consider the value of x as $ 1 $ , the value of y is
$ \Rightarrow y = 6\left( 1 \right) - 3 $
$ \Rightarrow y = 6 - 3 $
$ \Rightarrow y = 3 $
Now we consider the value of x as $ \dfrac{1}{2} $ , the value of y is
$ \Rightarrow y = 6\left( {\dfrac{1}{2}} \right) - 3 $
$ \Rightarrow y = 3 - 3 $
$ \Rightarrow y = 0 $
Now we draw a table for these values we have
Note: The graph plotted is of two dimensional. The graph is plotted in x-axis versus y axis. By the equation of a graph, we can plot the graph by assuming the value of x. We can’t assume the value of y because the value of y depends on the value of x.
Complete step-by-step answer:
Here in this question, we have to plot the graph for the given function. A graph of a function is a set of ordered pairs and it is represented as $ y = f\left( x \right) $ , where x and f(x) are real numbers. These pairs are in the form of cartesian form and the graph is the two-dimensional graph.
First, we have to find the value of y by using the graph equation $ y = 6x - 3 $ . Let we substitute the value of x as $ 0 $ , $ 1 $ , and $ \dfrac{1}{2} $ .
Now we consider the value of x as $ 0 $ , the value of y is
$ \Rightarrow y = 6\left( 0 \right) - 3 $
$ \Rightarrow y = - 3 $
Now we consider the value of x as $ 1 $ , the value of y is
$ \Rightarrow y = 6\left( 1 \right) - 3 $
$ \Rightarrow y = 6 - 3 $
$ \Rightarrow y = 3 $
Now we consider the value of x as $ \dfrac{1}{2} $ , the value of y is
$ \Rightarrow y = 6\left( {\dfrac{1}{2}} \right) - 3 $
$ \Rightarrow y = 3 - 3 $
$ \Rightarrow y = 0 $
Now we draw a table for these values we have
Note: The graph plotted is of two dimensional. The graph is plotted in x-axis versus y axis. By the equation of a graph, we can plot the graph by assuming the value of x. We can’t assume the value of y because the value of y depends on the value of x.
Recently Updated Pages
Match columnI with columnII and choose the correct class 12 biology NEET_UG
Match columnI with columnII and choose the correct class 12 biology NEET_UG
Match columnI with columnII and choose the correct class 12 biology NEET_UG
Which plant will lose its economic value if its fruits class 12 biology NEET_UG
The given figure shows two endocrine glands marked class 11 biology NEET_UG
Human insulin is being commercially produced from a class 12 biology NEET_UG
Trending doubts
What is BLO What is the full form of BLO class 8 social science CBSE
Write an experiment to show that chlorophyll is necessary class 8 chemistry CBSE
Citizens of India can vote at the age of A 18 years class 8 social science CBSE
Full form of STD, ISD and PCO
Name the states through which the Tropic of Cancer class 8 social science CBSE
What is the feminine gender of a stag class 8 english CBSE