


How do you graph the line using the slope intercept form $y = - 5x$?
Answer
528k+ views
Hint: In graph to the equation of the slope intercept form of a line $y = mx + b$, where m= slope and b = y-intercept . To graph a line, you need to draw two points and connect a line between them. In the case of using the slope-intercept form, you will be using a point (the y-intercept) and the slope (m) to find the next point.
Complete step by step solution:
that our slope is m=−5.
Now we can look at the y-intercept. Since we are looking at where the line crosses the y-axis, we already know that $x = 0$ at that point. b, the y-intercept is just 0 since the original equation does not have a value for b. This means that the line crosses the y-axis at the point where $y = 0$, so at the point with coordinates $(0,0)$.
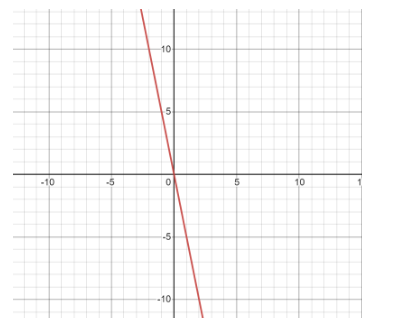
This is where we start (at the point $(0,0)$). From there, we draw the next point using the slope. We know the slope is -5, and since slope=change in y by change in x, we can say that it is $ - \dfrac{5}{1}$. This just means that we go 5 units up the y-axis and 1 unit left on the x-axis (since we have a negative sign) from the point $y = 0$ . This gives us a new point. Alternatively, we can go 5 units down the y-axis (since we have a negative sign) and 1 unit right. Now that we have two points, we connect them and we have our line. It looks like this:
graph\[\left\{ {y = - 5x{\text{ }}\left[ { - 10,{\text{ }}10,{\text{ }} - 5,{\text{ }}5} \right]} \right\}\]
Note: If you have a positive slope, you would either go up the y-axis and right on the x-axis, or down on the y-axis and left on the x-axis.
Cartesian Plane: A Cartesian Plane is given its name by the French mathematician Rene Descartes ,who first used this plane in the field of mathematics .It is defined as the two mutually perpendicular number line , the one which is horizontal is given name x-axis and the one which is vertical is known as y-axis. With the help of these axes we can plot any point on this cartesian plane with the help of an ordered pair of numbers.
Draw the cartesian plane only with the help of a straight ruler and pencil to get the perfect and accurate results.
.You can take any two points from the equation to plot the graph to the equation.
Complete step by step solution:
that our slope is m=−5.
Now we can look at the y-intercept. Since we are looking at where the line crosses the y-axis, we already know that $x = 0$ at that point. b, the y-intercept is just 0 since the original equation does not have a value for b. This means that the line crosses the y-axis at the point where $y = 0$, so at the point with coordinates $(0,0)$.
This is where we start (at the point $(0,0)$). From there, we draw the next point using the slope. We know the slope is -5, and since slope=change in y by change in x, we can say that it is $ - \dfrac{5}{1}$. This just means that we go 5 units up the y-axis and 1 unit left on the x-axis (since we have a negative sign) from the point $y = 0$ . This gives us a new point. Alternatively, we can go 5 units down the y-axis (since we have a negative sign) and 1 unit right. Now that we have two points, we connect them and we have our line. It looks like this:
graph\[\left\{ {y = - 5x{\text{ }}\left[ { - 10,{\text{ }}10,{\text{ }} - 5,{\text{ }}5} \right]} \right\}\]
Note: If you have a positive slope, you would either go up the y-axis and right on the x-axis, or down on the y-axis and left on the x-axis.
Cartesian Plane: A Cartesian Plane is given its name by the French mathematician Rene Descartes ,who first used this plane in the field of mathematics .It is defined as the two mutually perpendicular number line , the one which is horizontal is given name x-axis and the one which is vertical is known as y-axis. With the help of these axes we can plot any point on this cartesian plane with the help of an ordered pair of numbers.
Draw the cartesian plane only with the help of a straight ruler and pencil to get the perfect and accurate results.
.You can take any two points from the equation to plot the graph to the equation.
Recently Updated Pages
Master Class 11 Computer Science: Engaging Questions & Answers for Success
Master Class 11 Business Studies: Engaging Questions & Answers for Success
Master Class 11 Economics: Engaging Questions & Answers for Success
Master Class 11 English: Engaging Questions & Answers for Success
Master Class 11 Maths: Engaging Questions & Answers for Success
Master Class 11 Biology: Engaging Questions & Answers for Success
Trending doubts
One Metric ton is equal to kg A 10000 B 1000 C 100 class 11 physics CBSE
There are 720 permutations of the digits 1 2 3 4 5 class 11 maths CBSE
Discuss the various forms of bacteria class 11 biology CBSE
Draw a diagram of a plant cell and label at least eight class 11 biology CBSE
State the laws of reflection of light
Explain zero factorial class 11 maths CBSE