


How do you graph the line through point \[\left( { - 3, - 1} \right)\] and slope \[m = - \dfrac{1}{5}\]?
Answer
545.7k+ views
Hint: Here in this question, we have to plot the graph line which passes through the given point. before plotting the graph we have to find the equation of line which can be find by using the point-slope formula i.e., \[y - {y_1} = m\left( {x - {x_1}} \right)\] where m is the slope and \[\left( {{x_1},{y_1}} \right)\] is the point where the line passes, later plot the graph of the finding equation.
Complete step-by-step answer:
Given the line which passes through the point \[\left( { - 3, - 1} \right)\] and the line has a slope of \[m = - \dfrac{1}{5}\].
Here, we have to plot graph the line through point \[\left( { - 3, - 1} \right)\].
Before plotting, we have to find the equation of the line which passes through the point \[\left( {6,2} \right)\] and the slope \[m = - \dfrac{1}{5}\] by using the slope-point formula \[y - {y_1} = m\left( {x - {x_1}} \right)\]-------(1)
Substitute the slope m and the point \[\left( {{x_1},{y_1}} \right) = \left( { - 3, - 1} \right)\] in the point slope formula.
Consider the equation (1)
\[y - {y_1} = m\left( {x - {x_1}} \right)\]
Where, by given data \[m = - \dfrac{1}{5}\], \[{x_1} = - 3\] and \[{y_1} = - 1\] on substitution, we get
\[ \Rightarrow y - \left( { - 1} \right) = - \dfrac{1}{5}\left( {x - \left( { - 3} \right)} \right)\]
Using sign convention, we can written as
\[ \Rightarrow y + 1 = - \dfrac{1}{5}\left( {x + 3} \right)\]
Multiply both side by 5, then
\[ \Rightarrow 5\left( {y + 1} \right) = - \left( {x + 3} \right)\]
\[ \Rightarrow 5y + 5 = - x - 3\]
Subtract 5 on both side
\[ \Rightarrow 5y + 5 - 5 = - x - 3 - 5\]
On simplification, we get
\[ \Rightarrow 5y = - x - 8\]
Divide both side by 5, then
\[ \Rightarrow y = - \dfrac{1}{5}x - \dfrac{8}{5}\]
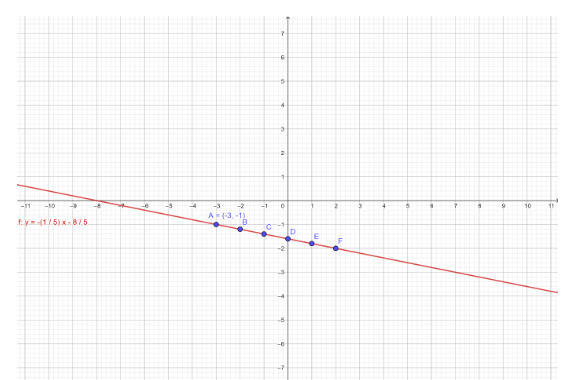
Hence, the equation of line that passes through point \[\left( { - 3, - 1} \right)\] and has a slope of \[m = - \dfrac{1}{5}\] is \[y = - \dfrac{1}{5}x - \dfrac{8}{5}\].
When giving the x values 0,1,2… simultaneously we get the y values
Now, the graph of the line \[y = - \dfrac{1}{5}x - \dfrac{8}{5}\] is:
Note: The graph is plotted x-axis versus y axis. The graph is two dimensional. By the equation of a graph, we can plot the graph by assuming the value of x. we can’t assume the value of y. because the value of y depends on the value of x. Hence, we have plotted the graph.
Complete step-by-step answer:
Given the line which passes through the point \[\left( { - 3, - 1} \right)\] and the line has a slope of \[m = - \dfrac{1}{5}\].
Here, we have to plot graph the line through point \[\left( { - 3, - 1} \right)\].
Before plotting, we have to find the equation of the line which passes through the point \[\left( {6,2} \right)\] and the slope \[m = - \dfrac{1}{5}\] by using the slope-point formula \[y - {y_1} = m\left( {x - {x_1}} \right)\]-------(1)
Substitute the slope m and the point \[\left( {{x_1},{y_1}} \right) = \left( { - 3, - 1} \right)\] in the point slope formula.
Consider the equation (1)
\[y - {y_1} = m\left( {x - {x_1}} \right)\]
Where, by given data \[m = - \dfrac{1}{5}\], \[{x_1} = - 3\] and \[{y_1} = - 1\] on substitution, we get
\[ \Rightarrow y - \left( { - 1} \right) = - \dfrac{1}{5}\left( {x - \left( { - 3} \right)} \right)\]
Using sign convention, we can written as
\[ \Rightarrow y + 1 = - \dfrac{1}{5}\left( {x + 3} \right)\]
Multiply both side by 5, then
\[ \Rightarrow 5\left( {y + 1} \right) = - \left( {x + 3} \right)\]
\[ \Rightarrow 5y + 5 = - x - 3\]
Subtract 5 on both side
\[ \Rightarrow 5y + 5 - 5 = - x - 3 - 5\]
On simplification, we get
\[ \Rightarrow 5y = - x - 8\]
Divide both side by 5, then
\[ \Rightarrow y = - \dfrac{1}{5}x - \dfrac{8}{5}\]
Hence, the equation of line that passes through point \[\left( { - 3, - 1} \right)\] and has a slope of \[m = - \dfrac{1}{5}\] is \[y = - \dfrac{1}{5}x - \dfrac{8}{5}\].
When giving the x values 0,1,2… simultaneously we get the y values
| \[x\] | \[ - 3\] | \[ - 2\] | \[ - 1\] | \[0\] | \[1\] | \[2\] |
| \[y = - \dfrac{1}{5}x - \dfrac{8}{5}\] | \[ - 1\] | \[ - \dfrac{6}{5}\] | \[ - \dfrac{7}{5}\] | \[ - \dfrac{8}{5}\] | \[ - \dfrac{9}{5}\] | \[ - 2\] |
| \[\left( {x,y} \right)\] | \[\left( { - 3, - 1} \right)\] | \[\left( { - 2, - \dfrac{6}{5}} \right)\] | \[\left( { - 1, - \dfrac{7}{5}} \right)\] | \[\left( {0, - \dfrac{8}{5}} \right)\] | \[\left( {1, - \dfrac{9}{5}} \right)\] | \[\left( {2, - 2} \right)\] |
Now, the graph of the line \[y = - \dfrac{1}{5}x - \dfrac{8}{5}\] is:
Note: The graph is plotted x-axis versus y axis. The graph is two dimensional. By the equation of a graph, we can plot the graph by assuming the value of x. we can’t assume the value of y. because the value of y depends on the value of x. Hence, we have plotted the graph.
Recently Updated Pages
Master Class 11 English: Engaging Questions & Answers for Success
Master Class 11 Maths: Engaging Questions & Answers for Success
Master Class 11 Biology: Engaging Questions & Answers for Success
Master Class 11 Social Science: Engaging Questions & Answers for Success
Master Class 11 Physics: Engaging Questions & Answers for Success
Master Class 11 Accountancy: Engaging Questions & Answers for Success
Trending doubts
One Metric ton is equal to kg A 10000 B 1000 C 100 class 11 physics CBSE
Discuss the various forms of bacteria class 11 biology CBSE
Draw a diagram of a plant cell and label at least eight class 11 biology CBSE
State the laws of reflection of light
Explain zero factorial class 11 maths CBSE
10 examples of friction in our daily life