


How do you graph the line given \[\left( -2,3 \right)\], $m=0$ ?
Answer
573.9k+ views
Hint: Problems of graph plotting can be easily solved by using the general equation of a straight line which is: $y=mx+c$ . We must first put the given coordinates and the value of $m$ (slope) in the general equation to get the actual equation of the straight line. After getting the equation of the straight line which is a line parallel to $y-axis$ we can plot it on the graph paper.
Complete step by step answer:
Any straight line can be easily plotted on the graph paper by taking a general equation of a straight line: $y=mx+c$
The coordinates of point $\left( -2,3 \right)$ is already given and we know that this point lies on the straight line. So, we will put $-2$ in place of $x$ and $3$ in place of $y$ .
Hence, we get the relation between $c$ and $m$ , which is $3=-2m+c$
Now, we further put $m=0$, in the above relation and we get $c=3$ .
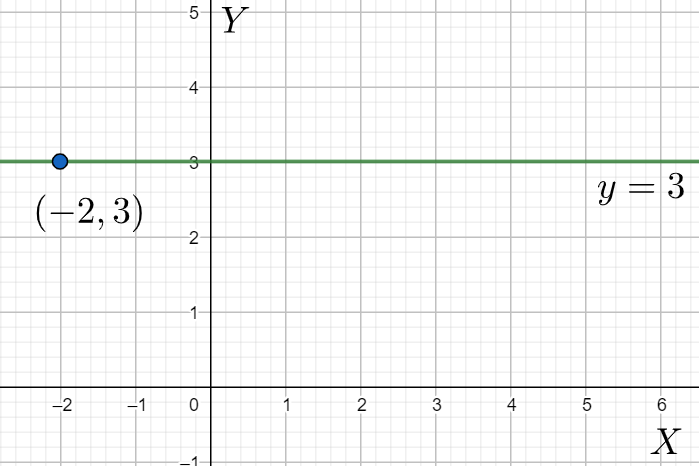
After putting the value of $m$ and $c$ in the general equation of the line we get the actual equation of the straight line which is $y=3$ .
As the slope $m$of the straight line is $0$ here, we can state that this line is parallel to $x$ -axis, that means the graph of this line is a horizontal line running through the $y$ -intercept at $\left( 0,3 \right)$ and must include the point \[\left( -2,3 \right)\].
Note: While solving graph problems of this type we must be careful while putting the coordinates in place of $x$, $y$ and $m$ to get the exact value of $c$ . Also, we must take additional care about putting the coordinates on the graph paper, as slight mistakes while plotting can degrade the quality of the graphed line.
Complete step by step answer:
Any straight line can be easily plotted on the graph paper by taking a general equation of a straight line: $y=mx+c$
The coordinates of point $\left( -2,3 \right)$ is already given and we know that this point lies on the straight line. So, we will put $-2$ in place of $x$ and $3$ in place of $y$ .
Hence, we get the relation between $c$ and $m$ , which is $3=-2m+c$
Now, we further put $m=0$, in the above relation and we get $c=3$ .
After putting the value of $m$ and $c$ in the general equation of the line we get the actual equation of the straight line which is $y=3$ .
As the slope $m$of the straight line is $0$ here, we can state that this line is parallel to $x$ -axis, that means the graph of this line is a horizontal line running through the $y$ -intercept at $\left( 0,3 \right)$ and must include the point \[\left( -2,3 \right)\].
Note: While solving graph problems of this type we must be careful while putting the coordinates in place of $x$, $y$ and $m$ to get the exact value of $c$ . Also, we must take additional care about putting the coordinates on the graph paper, as slight mistakes while plotting can degrade the quality of the graphed line.
Recently Updated Pages
Master Class 9 Social Science: Engaging Questions & Answers for Success
Master Class 9 Science: Engaging Questions & Answers for Success
Master Class 9 Maths: Engaging Questions & Answers for Success
Master Class 9 General Knowledge: Engaging Questions & Answers for Success
Class 9 Question and Answer - Your Ultimate Solutions Guide
Master Class 8 Social Science: Engaging Questions & Answers for Success
Trending doubts
Find the sum of series 1 + 2 + 3 + 4 + 5 + + 100 class 9 maths CBSE
What is the Full Form of ISI and RAW
Fill the blanks with the suitable prepositions 1 The class 9 english CBSE
Difference Between Plant Cell and Animal Cell
Who is eligible for RTE class 9 social science CBSE
What is pollution? How many types of pollution? Define it