


How do you graph the line $4x + 3y - 12 = 0$?
Answer
556.5k+ views
Hint: Write the given equation in the linear gradient form. Then find the intercepts of x by putting y equal to zero and then intercept y by putting x equal to zero we will get the points of the equation to plot on the graph. Using these points, plot the equation on the graph.
Complete step-by-step solution:
Firstly, we will find the x and y intercepts of the function in order to clearly recognize them. We have to convert the given equation to the linear gradient form that being: $y = mx + c$ …. let it be eq. $\left( 1 \right)$
, where c is the constant determining the y intercept. And m is the gradient of the function.
Therefore, let us do this:
$4x + 3y - 12 = 0$
Now separate the y variable by taking the x variable and the constant to the RHS of the equation.
$\Rightarrow$$3y = - 4x + 12$
After dividing both side by 3, we get:
$\Rightarrow$ $y = \dfrac{{ - 4x}}{3} + 4$
According to the linear gradient equation $y = mx + c$ we get $m = \dfrac{{ - 4}}{3}$ and $c = 4$ .
This implies that y intercept of the function is 4.
We can also prove this via the statement y intercept where $x = 0$ .
Therefore, $y = 0 \cdot x + 4$
This implies that the y intercept of the function is present at the point A $\left( {0,4} \right)$ .
Similarly, we will do this for x:
Now the linear gradient equation will be of the form $x = my + c$ , where c is the constant determining the x intercept. And m is the gradient of the function.
Therefore, let us do this:
$\Rightarrow$ $4x + 3y - 12 = 0$
Now, separate the x variable by taking the y variable and the constant to the RHS of the equation.
$\Rightarrow$$4x = - 3y + 12$
After dividing both side by 4, we get:
$\Rightarrow$ $x = \dfrac{{ - 3y}}{4} + 3$
According to the linear gradient equation $x = my + c$ we get, $m = \dfrac{{ - 3}}{4}$ and $c = 3$ .
This implies that x intercept of the function is 3.
We can also prove this via the statement x intercept where $y = 0$.
Therefore, $x = 0 \cdot y + 3$
This implies that the y intercept of the function is present at the point B$\left( {3,0} \right)$.
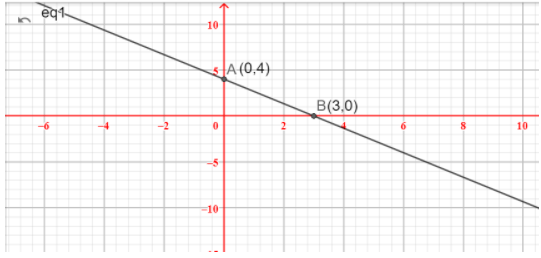
If we plot these points on a Cartesian plane and draw a line between the two points, the graph has been drawn like this:
Note: $y = mx + c$ is an important equation. The gradient, m, represents rate of change and the y-intercept, c, represents a starting value.
Any equation that can be rearranged into the form $y = mx + c$ will have a straight line graph. m is the gradient, or steepness of the graph, and c is the y-intercept, or where the line crosses the y-axis.
Gradient is a measure of steepness. As you move along a line from left to right, you might go up, you might go down or you might not change at all.
Gradients can be:
positive – going up
negative – going down
zero - no change (a flat line)
Complete step-by-step solution:
Firstly, we will find the x and y intercepts of the function in order to clearly recognize them. We have to convert the given equation to the linear gradient form that being: $y = mx + c$ …. let it be eq. $\left( 1 \right)$
, where c is the constant determining the y intercept. And m is the gradient of the function.
Therefore, let us do this:
$4x + 3y - 12 = 0$
Now separate the y variable by taking the x variable and the constant to the RHS of the equation.
$\Rightarrow$$3y = - 4x + 12$
After dividing both side by 3, we get:
$\Rightarrow$ $y = \dfrac{{ - 4x}}{3} + 4$
According to the linear gradient equation $y = mx + c$ we get $m = \dfrac{{ - 4}}{3}$ and $c = 4$ .
This implies that y intercept of the function is 4.
We can also prove this via the statement y intercept where $x = 0$ .
Therefore, $y = 0 \cdot x + 4$
This implies that the y intercept of the function is present at the point A $\left( {0,4} \right)$ .
Similarly, we will do this for x:
Now the linear gradient equation will be of the form $x = my + c$ , where c is the constant determining the x intercept. And m is the gradient of the function.
Therefore, let us do this:
$\Rightarrow$ $4x + 3y - 12 = 0$
Now, separate the x variable by taking the y variable and the constant to the RHS of the equation.
$\Rightarrow$$4x = - 3y + 12$
After dividing both side by 4, we get:
$\Rightarrow$ $x = \dfrac{{ - 3y}}{4} + 3$
According to the linear gradient equation $x = my + c$ we get, $m = \dfrac{{ - 3}}{4}$ and $c = 3$ .
This implies that x intercept of the function is 3.
We can also prove this via the statement x intercept where $y = 0$.
Therefore, $x = 0 \cdot y + 3$
This implies that the y intercept of the function is present at the point B$\left( {3,0} \right)$.
If we plot these points on a Cartesian plane and draw a line between the two points, the graph has been drawn like this:
Note: $y = mx + c$ is an important equation. The gradient, m, represents rate of change and the y-intercept, c, represents a starting value.
Any equation that can be rearranged into the form $y = mx + c$ will have a straight line graph. m is the gradient, or steepness of the graph, and c is the y-intercept, or where the line crosses the y-axis.
Gradient is a measure of steepness. As you move along a line from left to right, you might go up, you might go down or you might not change at all.
Gradients can be:
positive – going up
negative – going down
zero - no change (a flat line)
Recently Updated Pages
Master Class 10 Computer Science: Engaging Questions & Answers for Success
Master Class 10 General Knowledge: Engaging Questions & Answers for Success
Master Class 10 English: Engaging Questions & Answers for Success
Master Class 10 Social Science: Engaging Questions & Answers for Success
Master Class 10 Maths: Engaging Questions & Answers for Success
Master Class 10 Science: Engaging Questions & Answers for Success
Trending doubts
What is the median of the first 10 natural numbers class 10 maths CBSE
Which women's tennis player has 24 Grand Slam singles titles?
Who is the Brand Ambassador of Incredible India?
Why is there a time difference of about 5 hours between class 10 social science CBSE
Write a letter to the principal requesting him to grant class 10 english CBSE
A moving boat is observed from the top of a 150 m high class 10 maths CBSE