


How do you graph the inequality $y\le 4x-1$?
Answer
582.3k+ views
Hint: In this problem we need to draw off the given inequality. For this we need to first draw the graph of the equality. In this problem we have the inequality $y\le 4x-1$. Now the equality of the above inequality will become as $y=4x-1$. Now we will draw the graph of the equation $y=4x-1$ calculating the intercepts of the equation. We know that intercepts are the points where the given line meets the coordinate axis. To calculate intercepts, we will substitute $x=0$, $y=0$ in the given equation and we will calculate the remaining variable value. After calculating the intercept points, we will join them to get the graph of the line $y=4x-1$. But we need to draw the graph of inequality $y\le 4x-1$. In the inequality we have less than symbols so we will shade the area which is under the line $y=4x-1$ and that will be our required graph.
Complete step-by-step solution:
Given inequality $y\le 4x-1$.
Considering the equation $y=4x-1$.
Substituting $x=0$ in the above equation, then we will have
$\begin{align}
& y=4\left( 0 \right)-1 \\
& \Rightarrow y=-1 \\
\end{align}$
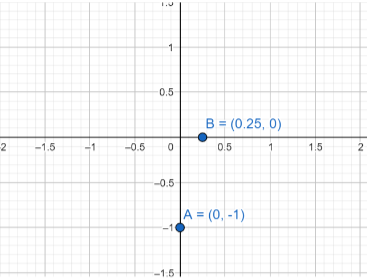
So, the point $\left( 0,-1 \right)$ is the $x-$intercept.
Substituting $y=0$ in the above equation, then we will get
$\begin{align}
& 0=4x-1 \\
& \Rightarrow 4x=1 \\
& \Rightarrow x=\frac{1}{4} \\
\end{align}$
So, the point $\left( \frac{1}{4},0 \right)$ is the $y-$intercept.
Plotting the two points in a graph paper, then we will get
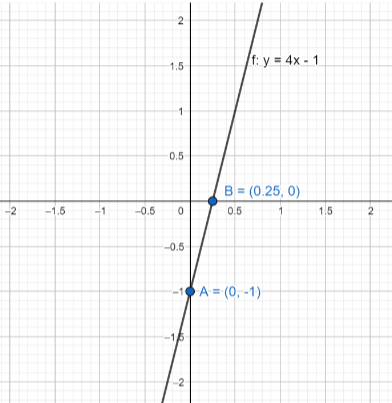
Joining the two points, then we will get the graph of the line $y=4x-1$ as
Now the graph of the inequality $y\le 4x-1$ will be the area under the line $y=4x-1$. So, we are going to shade the area under the line $y=4x-1$ to show a graph of the inequality $y\le 4x-1$.
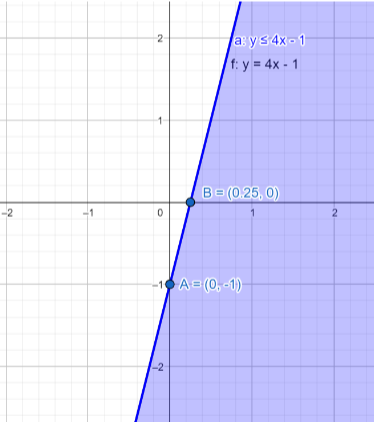
Note: In this problem they have asked to draw the inequality $y\le 4x-1$. So, we have shaded the area which is under the line $y=4x-1$. If they asked to draw the inequality $y\ge 4x-1$, then we will shade the area which is above the line $y=4x-1$.
Complete step-by-step solution:
Given inequality $y\le 4x-1$.
Considering the equation $y=4x-1$.
Substituting $x=0$ in the above equation, then we will have
$\begin{align}
& y=4\left( 0 \right)-1 \\
& \Rightarrow y=-1 \\
\end{align}$
So, the point $\left( 0,-1 \right)$ is the $x-$intercept.
Substituting $y=0$ in the above equation, then we will get
$\begin{align}
& 0=4x-1 \\
& \Rightarrow 4x=1 \\
& \Rightarrow x=\frac{1}{4} \\
\end{align}$
So, the point $\left( \frac{1}{4},0 \right)$ is the $y-$intercept.
Plotting the two points in a graph paper, then we will get
Joining the two points, then we will get the graph of the line $y=4x-1$ as
Now the graph of the inequality $y\le 4x-1$ will be the area under the line $y=4x-1$. So, we are going to shade the area under the line $y=4x-1$ to show a graph of the inequality $y\le 4x-1$.
Note: In this problem they have asked to draw the inequality $y\le 4x-1$. So, we have shaded the area which is under the line $y=4x-1$. If they asked to draw the inequality $y\ge 4x-1$, then we will shade the area which is above the line $y=4x-1$.
Recently Updated Pages
Master Class 11 Social Science: Engaging Questions & Answers for Success
Master Class 11 English: Engaging Questions & Answers for Success
Master Class 11 Maths: Engaging Questions & Answers for Success
Master Class 11 Chemistry: Engaging Questions & Answers for Success
Master Class 11 Biology: Engaging Questions & Answers for Success
Master Class 11 Physics: Engaging Questions & Answers for Success
Trending doubts
Differentiate between an exothermic and an endothermic class 11 chemistry CBSE
One Metric ton is equal to kg A 10000 B 1000 C 100 class 11 physics CBSE
Difference Between Prokaryotic Cells and Eukaryotic Cells
There are 720 permutations of the digits 1 2 3 4 5 class 11 maths CBSE
Two of the body parts which do not appear in MRI are class 11 biology CBSE
Which gas is abundant in air class 11 chemistry CBSE