


How do you graph the inequality $y\ge -5$?
Answer
602.1k+ views
Hint: Here in this question, we have to graphically represent the linear inequality. Basically linear equality is an equality which involves linear function. It also contains the symbols of inequality like in question, there is a use of greater than equal to symbol. Therefore it shows the data which is not equal in graph form.
Complete step by step answer:
Now, let’s solve the question.
As we all heard about linear equations. So, linear inequality is nothing but a linear equation in one or two variables such as y = 2x+1. But it will have an inequality like $>,<,\ge ,\le $.We represent the inequality in a graph by shading that portion.
There are some steps which are to be followed while graphing the inequalities. First of all rearrange the equation such that ‘y’ comes at the left and rest of the terms comes to the right. Next step is to plot that equation on the graph. For example if an equation is given: $y\le 2x-1$. In this, we need to plot the line for y = 2x – 1. And further we have to shade the area in which ‘y’ is less than 2x – 1.
Let’s perform all the steps for $y\ge -5$.
The equation is already arranged so we will move on plotting.
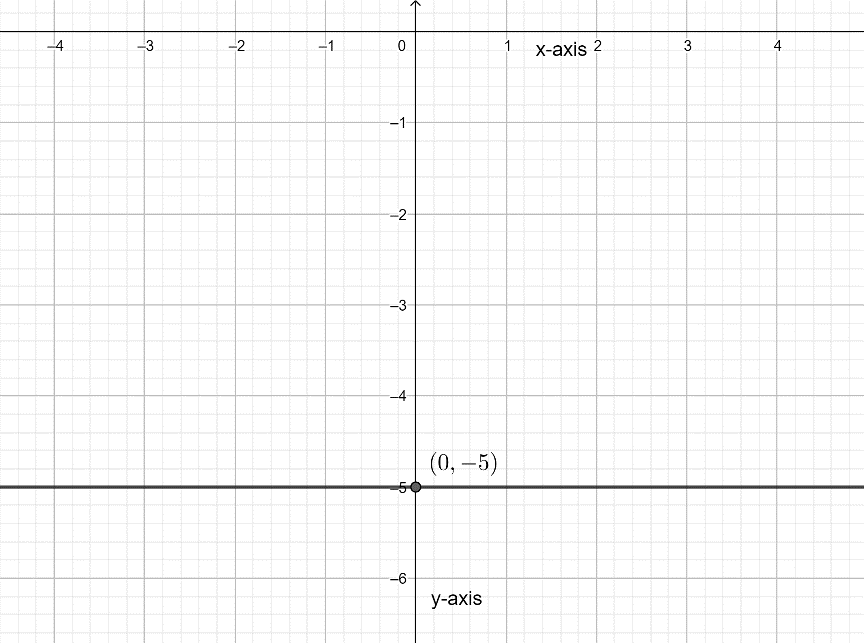
This graph is for y = -5. This show the line without an inequality.
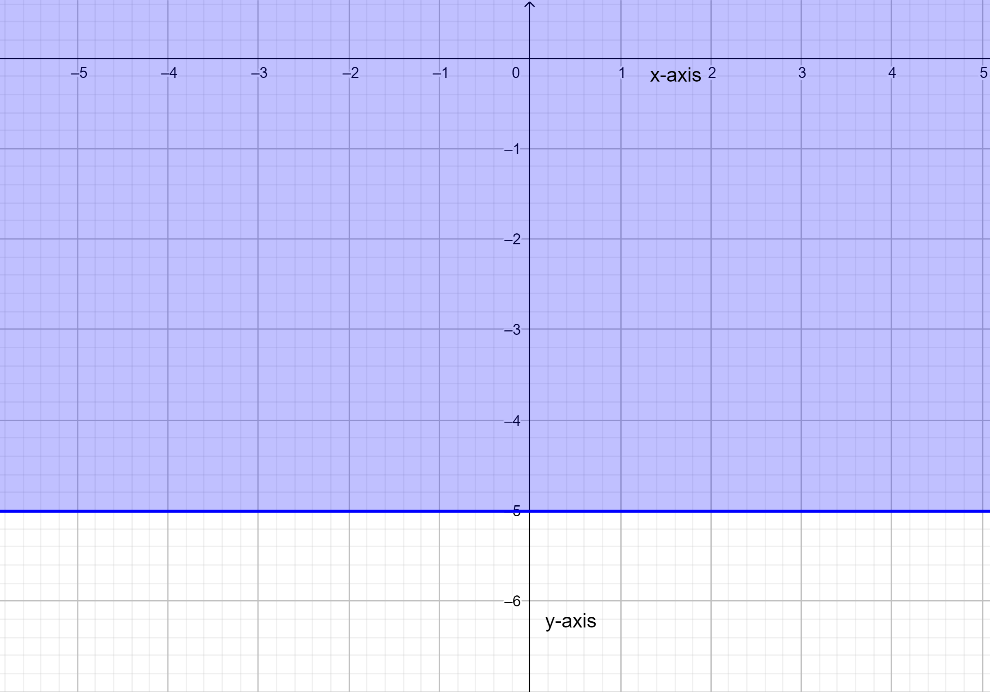
This is the graph of the inequality $y\ge -5$. This inequality is represented by the shaded portion.
Note: If you start plotting the equations directly from the question, then you will not be able to represent any equation properly. You will face errors. For graphs related to inequalities, move step by step and don’t forget to shade the area covered under that equation.
Complete step by step answer:
Now, let’s solve the question.
As we all heard about linear equations. So, linear inequality is nothing but a linear equation in one or two variables such as y = 2x+1. But it will have an inequality like $>,<,\ge ,\le $.We represent the inequality in a graph by shading that portion.
There are some steps which are to be followed while graphing the inequalities. First of all rearrange the equation such that ‘y’ comes at the left and rest of the terms comes to the right. Next step is to plot that equation on the graph. For example if an equation is given: $y\le 2x-1$. In this, we need to plot the line for y = 2x – 1. And further we have to shade the area in which ‘y’ is less than 2x – 1.
Let’s perform all the steps for $y\ge -5$.
The equation is already arranged so we will move on plotting.
This graph is for y = -5. This show the line without an inequality.
This is the graph of the inequality $y\ge -5$. This inequality is represented by the shaded portion.
Note: If you start plotting the equations directly from the question, then you will not be able to represent any equation properly. You will face errors. For graphs related to inequalities, move step by step and don’t forget to shade the area covered under that equation.

Recently Updated Pages
Master Class 8 English: Engaging Questions & Answers for Success
Master Class 8 Science: Engaging Questions & Answers for Success
Class 8 Question and Answer - Your Ultimate Solutions Guide
Master Class 8 Maths: Engaging Questions & Answers for Success
Master Class 8 Social Science: Engaging Questions & Answers for Success
Master Class 5 English: Engaging Questions & Answers for Success
Trending doubts
In Indian rupees 1 trillion is equal to how many c class 8 maths CBSE
What is BLO What is the full form of BLO class 8 social science CBSE
What helps Frog to breathe underwater class 8 biology CBSE
Citizens of India can vote at the age of A 18 years class 8 social science CBSE
Full form of STD, ISD and PCO
What is the feminine gender of a stag class 8 english CBSE