


How do you graph the inequality $ x>-1 $ and $ x<5 $ ?
Answer
558.3k+ views
Hint: The given interval is $ x>-1 $ or $ x<5 $ . The converted equation for variable $ x $ is for $ -1
Complete step-by-step answer:
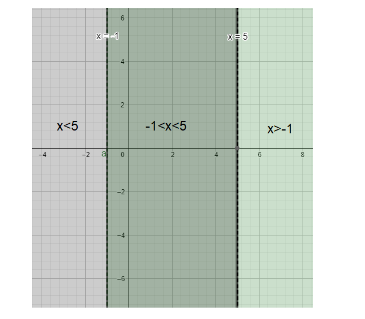
The given interval of x is $ -1The form $ -1This expression can also be expressed in other ways.
The use of brackets which explains the boundary. The use of ‘ $ \left( {} \right) $ ’ is for open boundary and the use of ‘ $ \left[ {} \right] $ ’ is for closed boundary.
The open boundary is used when we don’t include the boundary point and the closed boundary is used when we include the boundary point.
For our given interval $ x $ can never be equal to -1 or 5. This means we can include neither $ -1 $ nor 5.
The interval will be an open interval. The other expression for $ -1
We can also express as the complementary interval where $ x\notin \mathbb{R}\backslash \left( -1,5 \right) $ . This expression is mainly to show where the value of $ x $ can’t be.
Note: The interval is given for a real valued function where the variable does not belong in the imaginary part. That’s why we only used the notation of $ \mathbb{R} $ . Also, in case of imaginary intervals the respective values cannot be compared.
Complete step-by-step answer:
The given interval of x is $ -1
The use of brackets which explains the boundary. The use of ‘ $ \left( {} \right) $ ’ is for open boundary and the use of ‘ $ \left[ {} \right] $ ’ is for closed boundary.
The open boundary is used when we don’t include the boundary point and the closed boundary is used when we include the boundary point.
For our given interval $ x $ can never be equal to -1 or 5. This means we can include neither $ -1 $ nor 5.
The interval will be an open interval. The other expression for $ -1
We can also express as the complementary interval where $ x\notin \mathbb{R}\backslash \left( -1,5 \right) $ . This expression is mainly to show where the value of $ x $ can’t be.
Note: The interval is given for a real valued function where the variable does not belong in the imaginary part. That’s why we only used the notation of $ \mathbb{R} $ . Also, in case of imaginary intervals the respective values cannot be compared.

Recently Updated Pages
Master Class 8 Social Science: Engaging Questions & Answers for Success
Master Class 8 English: Engaging Questions & Answers for Success
Class 8 Question and Answer - Your Ultimate Solutions Guide
Master Class 8 Maths: Engaging Questions & Answers for Success
Master Class 8 Science: Engaging Questions & Answers for Success
Master Class 9 General Knowledge: Engaging Questions & Answers for Success
Trending doubts
What is BLO What is the full form of BLO class 8 social science CBSE
Citizens of India can vote at the age of A 18 years class 8 social science CBSE
Full form of STD, ISD and PCO
Advantages and disadvantages of science
Right to vote is a AFundamental Right BFundamental class 8 social science CBSE
What are the 12 elements of nature class 8 chemistry CBSE