


How do you graph the inequality \[x + y < 4\] ?
Answer
563.7k+ views
Hint: First we need to draw the graph of the equation \[x + y = 4\]. We use intercept form to draw the graph. That is we find the coordinate of the given equation lying on the line of x- axis, we can find this by substituting the value of ‘y’ is equal to zero (x-intercept). Similarly we can find the coordinate of the equation lying on the line of y- axis, we can find this by substituting the value of ‘x’ equal to zero (y-intercept). After drawing the graph we can check in which region the inequality satisfies.
Complete step by step answer:
Given, \[x + y < 4\]. Now consider \[x + y = 4\],to find the x-intercept. That is the value of ‘x’ at\[y = 0\]. Substituting this in the given equation. We have,
\[x + 0 = 4\]
\[ \Rightarrow x = 4\]
Thus we have a coordinate of the equation which lies on the line of x-axis. The coordinate is \[(4,0)\]. To find the y-intercept. That is the value of ‘y’ at \[x = 0\]. Substituting this in the given equation we have,
\[0 + y = 4\]
\[ \Rightarrow y = 4\]
Thus we have a coordinate of the equation which lies on the line of y-axis. The coordinate is \[(0,4)\]. Thus we have the coordinates \[(4,0)\] and \[(0,4)\]. Let’s plot a graph for these coordinates,we take scale x-axis= 1 unit = 1 units and y-axis= 1 unit = 1 units.
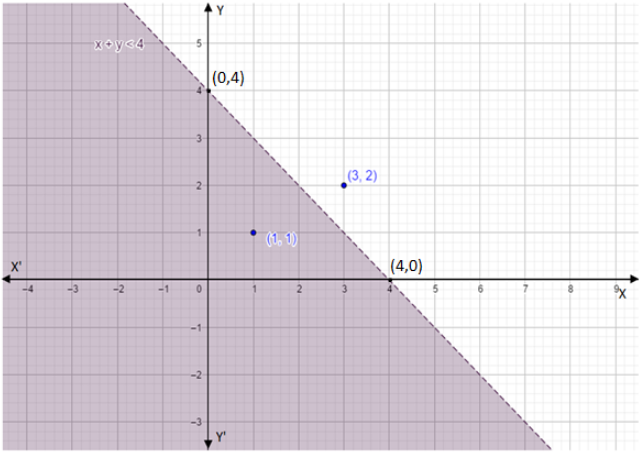
We expanded the point touching the intercepts. We took a coordinate above and below the equation of line (see in above graph). That is \[(x,y) = (3,2)\] and now put it in the inequality,
\[3 + 2 < 4\]
\[ \Rightarrow 5 < 4\]. Which is wrong.
Now take a coordinate below the equation of line,
That is \[(x,y) = (1,1)\]
\[1 + 1 < 4\]
\[ \Rightarrow 2 < 4\]. Which is true.
In the above graph the shaded region is the solution of the given inequality.
Note: If we take any coordinate point below the line of the graph, the inequality satisfies. Also if we take a point on the line, the inequality won’t be satisfied. A graph shows the relation between two variable quantities, it contains two axes perpendicular to each other namely the x-axis and the y-axis. Each variable is measured along one of the axes. In the question, we are given one linear equation containing two variables namely x and y, x is measured along the x-axis and y is measured along the y-axis while tracing the given equations.
Complete step by step answer:
Given, \[x + y < 4\]. Now consider \[x + y = 4\],to find the x-intercept. That is the value of ‘x’ at\[y = 0\]. Substituting this in the given equation. We have,
\[x + 0 = 4\]
\[ \Rightarrow x = 4\]
Thus we have a coordinate of the equation which lies on the line of x-axis. The coordinate is \[(4,0)\]. To find the y-intercept. That is the value of ‘y’ at \[x = 0\]. Substituting this in the given equation we have,
\[0 + y = 4\]
\[ \Rightarrow y = 4\]
Thus we have a coordinate of the equation which lies on the line of y-axis. The coordinate is \[(0,4)\]. Thus we have the coordinates \[(4,0)\] and \[(0,4)\]. Let’s plot a graph for these coordinates,we take scale x-axis= 1 unit = 1 units and y-axis= 1 unit = 1 units.
We expanded the point touching the intercepts. We took a coordinate above and below the equation of line (see in above graph). That is \[(x,y) = (3,2)\] and now put it in the inequality,
\[3 + 2 < 4\]
\[ \Rightarrow 5 < 4\]. Which is wrong.
Now take a coordinate below the equation of line,
That is \[(x,y) = (1,1)\]
\[1 + 1 < 4\]
\[ \Rightarrow 2 < 4\]. Which is true.
In the above graph the shaded region is the solution of the given inequality.
Note: If we take any coordinate point below the line of the graph, the inequality satisfies. Also if we take a point on the line, the inequality won’t be satisfied. A graph shows the relation between two variable quantities, it contains two axes perpendicular to each other namely the x-axis and the y-axis. Each variable is measured along one of the axes. In the question, we are given one linear equation containing two variables namely x and y, x is measured along the x-axis and y is measured along the y-axis while tracing the given equations.
Recently Updated Pages
Master Class 9 Social Science: Engaging Questions & Answers for Success
Master Class 9 Science: Engaging Questions & Answers for Success
Master Class 9 Maths: Engaging Questions & Answers for Success
Master Class 9 General Knowledge: Engaging Questions & Answers for Success
Class 9 Question and Answer - Your Ultimate Solutions Guide
Master Class 8 Social Science: Engaging Questions & Answers for Success
Trending doubts
Find the sum of series 1 + 2 + 3 + 4 + 5 + + 100 class 9 maths CBSE
What is the Full Form of ISI and RAW
Fill the blanks with the suitable prepositions 1 The class 9 english CBSE
Difference Between Plant Cell and Animal Cell
Who is eligible for RTE class 9 social science CBSE
What is pollution? How many types of pollution? Define it