


How do you graph the inequality \[x + 5y \leqslant 10\] on the coordinate plane?
Answer
562.2k+ views
Hint: First we need to draw the graph of the equation \[x + 5y = 10\] . We use intercept form to draw the graph. That is we find the coordinate of the given equation lying on the line of x- axis, we can find this by substituting the value of ‘y’ is equal to zero (x-intercept). Similarly we can find the coordinate of the equation lying on the line of y- axis, we can find this by substituting the value of ‘x’ equal to zero (y-intercept). After drawing the graph we can check in which region the inequality satisfies.
Complete step-by-step answer:
Given, \[x + 5y \leqslant 10\]
Now consider \[x + 5y = 10\] ,
To find the x-intercept. That is the value of ‘x’ at \[y = 0\] . Substituting this in the given equation. We have,
\[x + 5(0) = 10\]
\[ \Rightarrow x = 10\]
Thus we have a coordinate of the equation which lies on the line of x-axis. The coordinate is \[(10,0)\] .
To find the y-intercept. That is the value of ‘y’ at \[x = 0\] . Substituting this in the given equation we have,
\[0 + 5y = 10\]
\[5y = 10\]
Divide by 5 on both side,
\[y = \dfrac{{10}}{5}\]
\[ \Rightarrow y = 2\]
Thus we have a coordinate of the equation which lies on the line of the y-axis. The coordinate is \[(0,2)\] .
Thus we have the coordinates \[(10,0)\] and \[(0,2)\] .
Let’s plot a graph for this coordinates,
We take scale
x-axis= 1 unit = 1 units
y-axis= 1 unit = 1 units
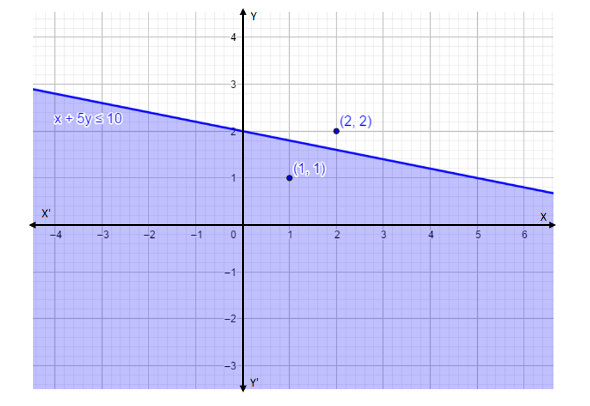
We expanded the point touching the intercepts. We took a coordinate above and below the equation of line (see in above graph).
That is \[(x,y) = (2,2)\] and now put it in the inequality,
\[2 + 5\left( 2 \right) \leqslant 10\]
\[2 + 10 \leqslant 10\]
\[ \Rightarrow 12 \leqslant 10\] . Which is wrong.
Now take a coordinate below the equation of line,
That is \[(x,y) = (1,1)\]
\[1 + 5\left( 1 \right) \leqslant 10\]
\[1 + 5 \leqslant 10\]
\[ \Rightarrow 6 \leqslant 10\] . Which is true.
In the above graph the shaded region is the solution of the given inequality.
Note: If we take any coordinate point below the line of the graph, the inequality satisfies. Also if we take a point on the line, the inequality will be satisfied. A graph shows the relation between two variable quantities, it contains two axes perpendicular to each other namely the x-axis and the y-axis. Each variable is measured along one of the axes. In the question, we are given one linear equation containing two variables namely x and y, x is measured along the x-axis and y is measured along the y-axis while tracing the given equations.
Complete step-by-step answer:
Given, \[x + 5y \leqslant 10\]
Now consider \[x + 5y = 10\] ,
To find the x-intercept. That is the value of ‘x’ at \[y = 0\] . Substituting this in the given equation. We have,
\[x + 5(0) = 10\]
\[ \Rightarrow x = 10\]
Thus we have a coordinate of the equation which lies on the line of x-axis. The coordinate is \[(10,0)\] .
To find the y-intercept. That is the value of ‘y’ at \[x = 0\] . Substituting this in the given equation we have,
\[0 + 5y = 10\]
\[5y = 10\]
Divide by 5 on both side,
\[y = \dfrac{{10}}{5}\]
\[ \Rightarrow y = 2\]
Thus we have a coordinate of the equation which lies on the line of the y-axis. The coordinate is \[(0,2)\] .
Thus we have the coordinates \[(10,0)\] and \[(0,2)\] .
Let’s plot a graph for this coordinates,
We take scale
x-axis= 1 unit = 1 units
y-axis= 1 unit = 1 units
We expanded the point touching the intercepts. We took a coordinate above and below the equation of line (see in above graph).
That is \[(x,y) = (2,2)\] and now put it in the inequality,
\[2 + 5\left( 2 \right) \leqslant 10\]
\[2 + 10 \leqslant 10\]
\[ \Rightarrow 12 \leqslant 10\] . Which is wrong.
Now take a coordinate below the equation of line,
That is \[(x,y) = (1,1)\]
\[1 + 5\left( 1 \right) \leqslant 10\]
\[1 + 5 \leqslant 10\]
\[ \Rightarrow 6 \leqslant 10\] . Which is true.
In the above graph the shaded region is the solution of the given inequality.
Note: If we take any coordinate point below the line of the graph, the inequality satisfies. Also if we take a point on the line, the inequality will be satisfied. A graph shows the relation between two variable quantities, it contains two axes perpendicular to each other namely the x-axis and the y-axis. Each variable is measured along one of the axes. In the question, we are given one linear equation containing two variables namely x and y, x is measured along the x-axis and y is measured along the y-axis while tracing the given equations.

Recently Updated Pages
Master Class 8 Social Science: Engaging Questions & Answers for Success
Master Class 8 Science: Engaging Questions & Answers for Success
Master Class 8 Maths: Engaging Questions & Answers for Success
Class 8 Question and Answer - Your Ultimate Solutions Guide
Master Class 9 Social Science: Engaging Questions & Answers for Success
Master Class 9 Science: Engaging Questions & Answers for Success
Trending doubts
What are gulf countries and why they are called Gulf class 8 social science CBSE
What is BLO What is the full form of BLO class 8 social science CBSE
Give full form of LPG and CNG class 8 chemistry CBSE
Citizens of India can vote at the age of A 18 years class 8 social science CBSE
Advantages and disadvantages of science
Give me the opposite gender of Duck class 8 english CBSE