


How do you graph the inequality $8x + y \leqslant 6$?
Answer
572.4k+ views
Hint: We will first treat it as an equality and find the equation of line by plotting any two points on it. Now, we will just shade the region accordingly and get the required region.
Complete step-by-step answer:
We are given that we are required to graph the inequality $8x + y \leqslant 6$.
Instead of treating it as in inequality, let us for once remove its less than sign and treat it as an inequality.
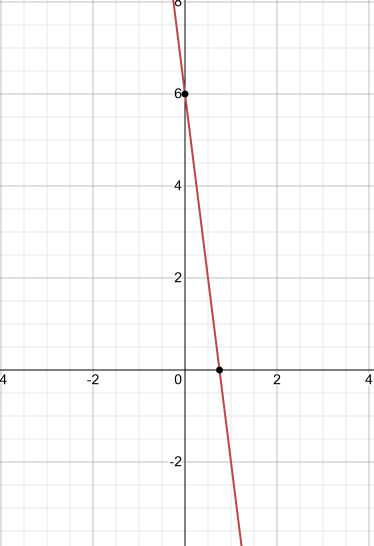
So, now we need to graph 8x + y = 6.
Now, we will just find two points on this line and thus join them to form the above line.
If we put x = 0, then we get y = 6.
If we put y = - 2, then we get x = 1.
We get the following table:-
Now, let us plot this line.
Now, we have got the line and we see that, we have the inequality of less than, therefore, the shading will be inside and we will get the following graph:-
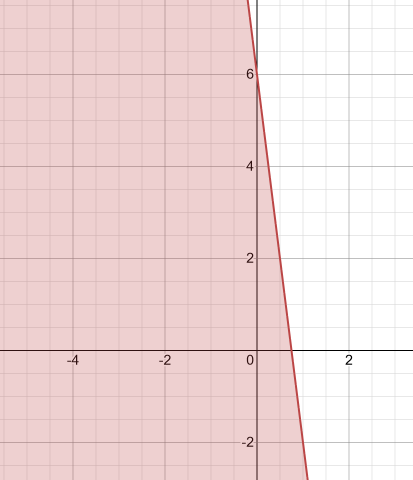
Thus, we have the required graph.
Note:
The students must note that we first treated the given inequality as an equality because we first needed to find the boundary line of the graph and after finding the boundary line, we just see where the graph intends to be.
To check whether we have to shade inwards towards the origin or outwards, you should just put origin in the given inequality and if you get the correct result, you shade inwards, otherwise outwards.
Like here, we had $8x + y \leqslant 6$. If we put x and y to both be zero, then we get $0 \leqslant 6$, which is absolutely correct. Therefore, we just shade towards the origin side that is inwards and get the obtained graph.
Complete step-by-step answer:
We are given that we are required to graph the inequality $8x + y \leqslant 6$.
Instead of treating it as in inequality, let us for once remove its less than sign and treat it as an inequality.
So, now we need to graph 8x + y = 6.
Now, we will just find two points on this line and thus join them to form the above line.
If we put x = 0, then we get y = 6.
If we put y = - 2, then we get x = 1.
We get the following table:-
| x | 0 | 1 |
| y | 6 | -2 |
Now, let us plot this line.
Now, we have got the line and we see that, we have the inequality of less than, therefore, the shading will be inside and we will get the following graph:-
Thus, we have the required graph.
Note:
The students must note that we first treated the given inequality as an equality because we first needed to find the boundary line of the graph and after finding the boundary line, we just see where the graph intends to be.
To check whether we have to shade inwards towards the origin or outwards, you should just put origin in the given inequality and if you get the correct result, you shade inwards, otherwise outwards.
Like here, we had $8x + y \leqslant 6$. If we put x and y to both be zero, then we get $0 \leqslant 6$, which is absolutely correct. Therefore, we just shade towards the origin side that is inwards and get the obtained graph.
Recently Updated Pages
Basicity of sulphurous acid and sulphuric acid are
Master Class 11 Business Studies: Engaging Questions & Answers for Success
Master Class 11 Computer Science: Engaging Questions & Answers for Success
Master Class 11 Economics: Engaging Questions & Answers for Success
Master Class 11 Social Science: Engaging Questions & Answers for Success
Master Class 11 English: Engaging Questions & Answers for Success
Trending doubts
One Metric ton is equal to kg A 10000 B 1000 C 100 class 11 physics CBSE
The largest wind power cluster is located in the state class 11 social science CBSE
Explain zero factorial class 11 maths CBSE
State and prove Bernoullis theorem class 11 physics CBSE
Which among the following are examples of coming together class 11 social science CBSE
Can anyone list 10 advantages and disadvantages of friction