


How will you graph the inequality $6x+5y<-30$?
Answer
586.5k+ views
Hint: Now to plot the graph we will first consider the corresponding equality. Now we will first write the equation such that we get y in terms of x. Now we will substitute the value of x and find the corresponding value of y. Hence we will get the point (x, y) on the line. Now we will use these points to plot the equation of line. Now take points on both sides of the line and check which part satisfies the inequality. Hence we will get the required graph.
Complete step by step solution:
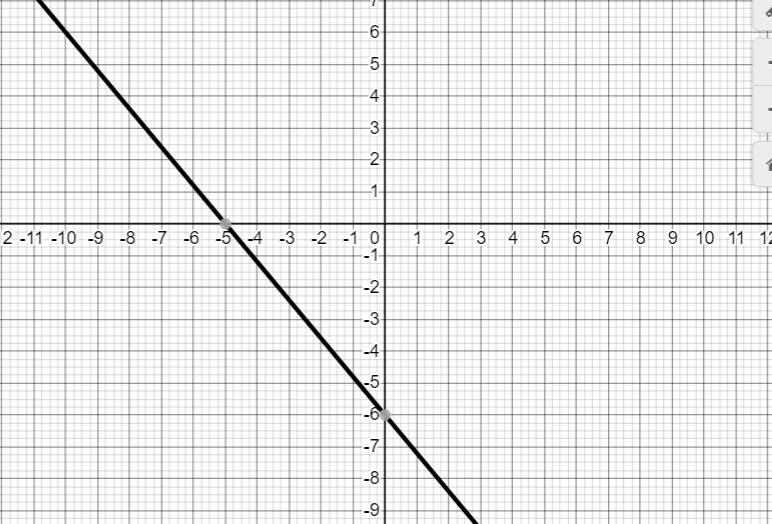
Now to graph the inequality we will first make a graph of the line $6x+5y=-30$.
Now to draw the graph of the equation we will need to find at least two points (x, y) such that it satisfies the given equation. Then we will draw a line passing through the points.
Now let us rearrange the terms of the equation such that we can express y as a function of x.
$\Rightarrow 5y=-30-6x$
Now dividing the whole equation by 5 we get,
$\Rightarrow y=-6-\dfrac{6}{5}x$
Hence we have y in terms of x.
Now let us substitute x = 0. Then we get y = -6.
Hence (0, -6) is a point on the line.
Now let us substitute x = - 5 then we get $y=-6-6\left( \dfrac{-5}{5} \right)=0$
Hence we have (- 5, 0) is a point on the line.
Now let us plot the points (0, -6) and (-5, 0) on the graph and draw a line passing through the points.
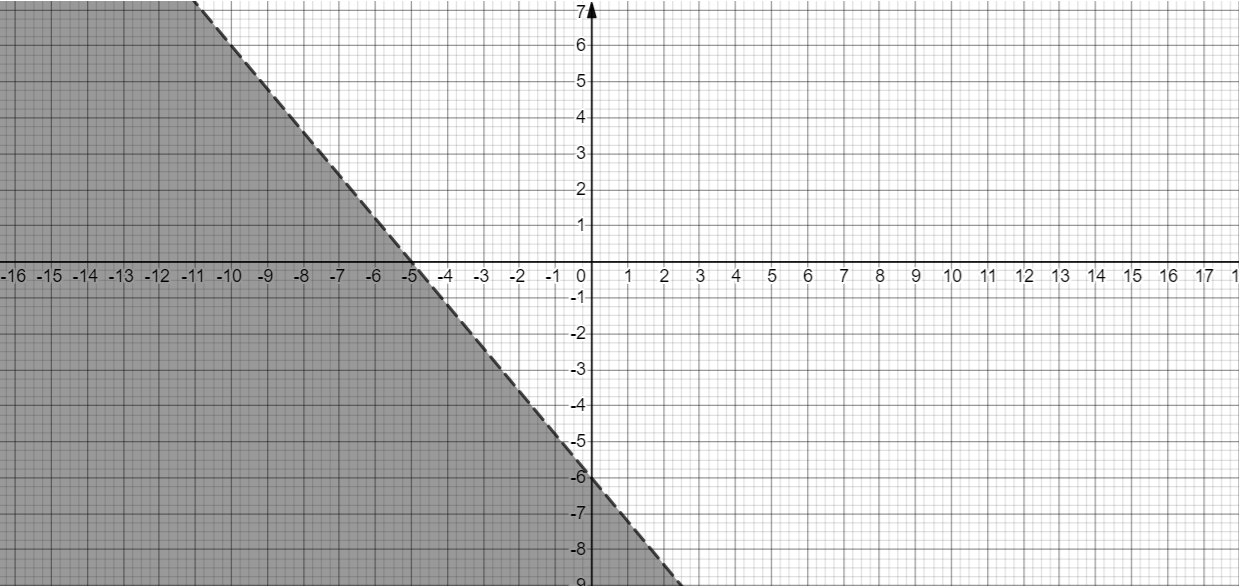
Now since we want inequality $6x+5y<-30$
Let us check any point below the line let us say (0, -7) then we have 6(0) + 5(-7) = -35 which is less than -30.
Now since the equation holds for one point below the line we can say that the equation holds for all point below the line. Hence the graph of inequality is.
Note:
Now while drawing inequalities always note that first draw the line where equality holds. Now this line will divide the graph in two parts. One part where the inequality holds other where the inequality does not hold. Hence we will find the area by selecting any one point and checking if the equality holds.
Complete step by step solution:
Now to graph the inequality we will first make a graph of the line $6x+5y=-30$.
Now to draw the graph of the equation we will need to find at least two points (x, y) such that it satisfies the given equation. Then we will draw a line passing through the points.
Now let us rearrange the terms of the equation such that we can express y as a function of x.
$\Rightarrow 5y=-30-6x$
Now dividing the whole equation by 5 we get,
$\Rightarrow y=-6-\dfrac{6}{5}x$
Hence we have y in terms of x.
Now let us substitute x = 0. Then we get y = -6.
Hence (0, -6) is a point on the line.
Now let us substitute x = - 5 then we get $y=-6-6\left( \dfrac{-5}{5} \right)=0$
Hence we have (- 5, 0) is a point on the line.
Now let us plot the points (0, -6) and (-5, 0) on the graph and draw a line passing through the points.
Now since we want inequality $6x+5y<-30$
Let us check any point below the line let us say (0, -7) then we have 6(0) + 5(-7) = -35 which is less than -30.
Now since the equation holds for one point below the line we can say that the equation holds for all point below the line. Hence the graph of inequality is.
Note:
Now while drawing inequalities always note that first draw the line where equality holds. Now this line will divide the graph in two parts. One part where the inequality holds other where the inequality does not hold. Hence we will find the area by selecting any one point and checking if the equality holds.
Recently Updated Pages
Master Class 11 Social Science: Engaging Questions & Answers for Success
Master Class 11 English: Engaging Questions & Answers for Success
Master Class 11 Maths: Engaging Questions & Answers for Success
Master Class 11 Chemistry: Engaging Questions & Answers for Success
Master Class 11 Biology: Engaging Questions & Answers for Success
Class 11 Question and Answer - Your Ultimate Solutions Guide
Trending doubts
One Metric ton is equal to kg A 10000 B 1000 C 100 class 11 physics CBSE
Difference Between Prokaryotic Cells and Eukaryotic Cells
Find the value of the expression given below sin 30circ class 11 maths CBSE
1 ton equals to A 100 kg B 1000 kg C 10 kg D 10000 class 11 physics CBSE
Two of the body parts which do not appear in MRI are class 11 biology CBSE
Draw a diagram of nephron and explain its structur class 11 biology CBSE