


How do you graph the inequality $6x+3y>12$ ?
Answer
571.2k+ views
Hint: At first, we write the inequality in the form of an equation. We then draw the line shown by this equation. The entire plane is now divided into two parts. We now put the origin in the inequality to see which region belongs to the inequality.
Complete step-by-step solution:
Inequalities are those forms of expressions which don’t have any definite solution. Inequalities claim that the value of a certain expression should lie in a certain region, not a definite point like an equation. For example, the equation $x+y=0$ means that the expression $x+y$ should always be $0$ , but the inequality $x+y>0$ means that the expression $x+y$ should have its value more than $0$ ; its can be any value, but it must be greater than $0$ .
A linear equation, having a definite meaning, is always represented by a straight line on a plane. All the values of $\left( x,y \right)$ satisfying the equation, lie on the line. But, an inequality having no such definite meaning, is represented by an area on a plane. All the values of $\left( x,y \right)$ satisfying the inequality, lie on the area.
The given inequality is
$6x+3y>12$
We graph the inequality by first writing the inequality as an equation, which is
$\Rightarrow 6x+3y=12$
We then draw the graph of this equation, which is nothing but a straight line by using any one of the different methods convenient for this one. This line $6x+3y=12$ divides the entire plane into two areas. But, out of these two areas, only one area is represented by the inequality $6x+3y>12$ . We find this area by taking the point $\left( 0,0 \right)$ that is the origin and put it in the inequality. The inequality thus becomes,
$\begin{align}
& \Rightarrow 6\left( 0 \right)+3\left( 0 \right)>12 \\
& \Rightarrow 0>12 \\
\end{align}$
Which is not true. This means that the origin does not satisfy the inequality. In other words, we can say that the area corresponding to the origin side is not the region corresponding to the inequality. We are left with only one more area, which is the required region on the graph.
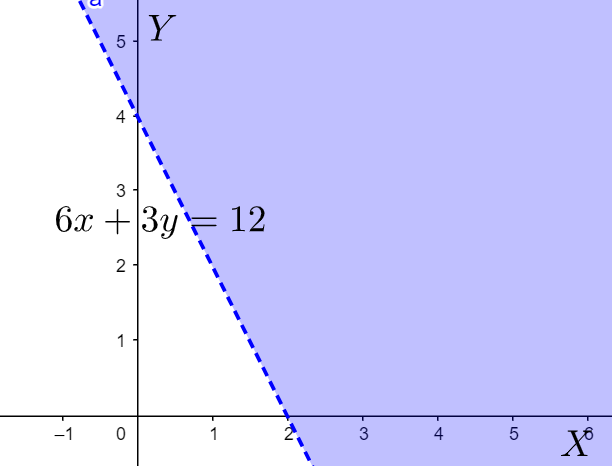
The corresponding region is shown by the blue shaded area in the above graph.
Note: We must be careful while drawing the line corresponding to the equation form of the inequality. The required region can be judged by putting any other point than the origin, though putting the origin is the simplest. We must not put any point which lies on the line itself.
Complete step-by-step solution:
Inequalities are those forms of expressions which don’t have any definite solution. Inequalities claim that the value of a certain expression should lie in a certain region, not a definite point like an equation. For example, the equation $x+y=0$ means that the expression $x+y$ should always be $0$ , but the inequality $x+y>0$ means that the expression $x+y$ should have its value more than $0$ ; its can be any value, but it must be greater than $0$ .
A linear equation, having a definite meaning, is always represented by a straight line on a plane. All the values of $\left( x,y \right)$ satisfying the equation, lie on the line. But, an inequality having no such definite meaning, is represented by an area on a plane. All the values of $\left( x,y \right)$ satisfying the inequality, lie on the area.
The given inequality is
$6x+3y>12$
We graph the inequality by first writing the inequality as an equation, which is
$\Rightarrow 6x+3y=12$
We then draw the graph of this equation, which is nothing but a straight line by using any one of the different methods convenient for this one. This line $6x+3y=12$ divides the entire plane into two areas. But, out of these two areas, only one area is represented by the inequality $6x+3y>12$ . We find this area by taking the point $\left( 0,0 \right)$ that is the origin and put it in the inequality. The inequality thus becomes,
$\begin{align}
& \Rightarrow 6\left( 0 \right)+3\left( 0 \right)>12 \\
& \Rightarrow 0>12 \\
\end{align}$
Which is not true. This means that the origin does not satisfy the inequality. In other words, we can say that the area corresponding to the origin side is not the region corresponding to the inequality. We are left with only one more area, which is the required region on the graph.
The corresponding region is shown by the blue shaded area in the above graph.
Note: We must be careful while drawing the line corresponding to the equation form of the inequality. The required region can be judged by putting any other point than the origin, though putting the origin is the simplest. We must not put any point which lies on the line itself.
Recently Updated Pages
Master Class 11 Social Science: Engaging Questions & Answers for Success
Master Class 11 Physics: Engaging Questions & Answers for Success
Master Class 11 Maths: Engaging Questions & Answers for Success
Master Class 11 Economics: Engaging Questions & Answers for Success
Master Class 11 Computer Science: Engaging Questions & Answers for Success
Master Class 11 Chemistry: Engaging Questions & Answers for Success
Trending doubts
One Metric ton is equal to kg A 10000 B 1000 C 100 class 11 physics CBSE
How many bones are in the spine class 11 biology CBSE
1 Quintal is equal to a 110 kg b 10 kg c 100kg d 1000 class 11 physics CBSE
There are 720 permutations of the digits 1 2 3 4 5 class 11 maths CBSE
State and prove Bernoullis theorem class 11 physics CBSE
Difference Between Prokaryotic Cells and Eukaryotic Cells