


How do you graph the inequality $4x + 6y \geqslant 10$ ?
Answer
533.1k+ views
Hint: In the given question, we have to plot the graph of the inequality given to us in the problem. So, to plot the graph of an inequality, we have to first sketch the graph of the line obtained by replacing the inequality sign by “equals to” sign.
Complete step by step solution:
Here in this question, we have to plot the graph for the given inequality.
So, the given inequality is $4x + 6y \geqslant 10$.
Now, we replace the inequality sign with an “equals to” sign so as to get the equation of a line.
So, we get $4x + 6y = 10$.
Now, we have to sketch this line first in order to draw the graph of the required inequality.
So, we have to find the value of y by using the equation $4x + 6y = 10$. Let us substitute the value of x as $0$, $1$, and $\dfrac{5}{2}$.
Now we consider the value of x as $0$, the value of y is
\[ \Rightarrow 4\left( 0 \right) + 6y = 10\]
$ \Rightarrow 6y = 10$
$ \Rightarrow y = \dfrac{{10}}{6} = \dfrac{5}{3}$
Now we consider the value of x as $1$, the value of y is
\[ \Rightarrow 4\left( 1 \right) + 6y = 10\]
\[ \Rightarrow 6y = 10 - 4\]
\[ \Rightarrow 6y = 6\]
\[ \Rightarrow y = \dfrac{6}{6} = 1\]
Now we consider the value of x as $\dfrac{5}{2}$, the value of y is
\[ \Rightarrow 4\left( {\dfrac{5}{2}} \right) + 6y = 10\]
\[ \Rightarrow 10 + 6y = 10\]
\[ \Rightarrow 6y = 10 - 10\]
\[ \Rightarrow 6y = 0\]
\[ \Rightarrow y = 0\]
Now we draw a table for these values we have
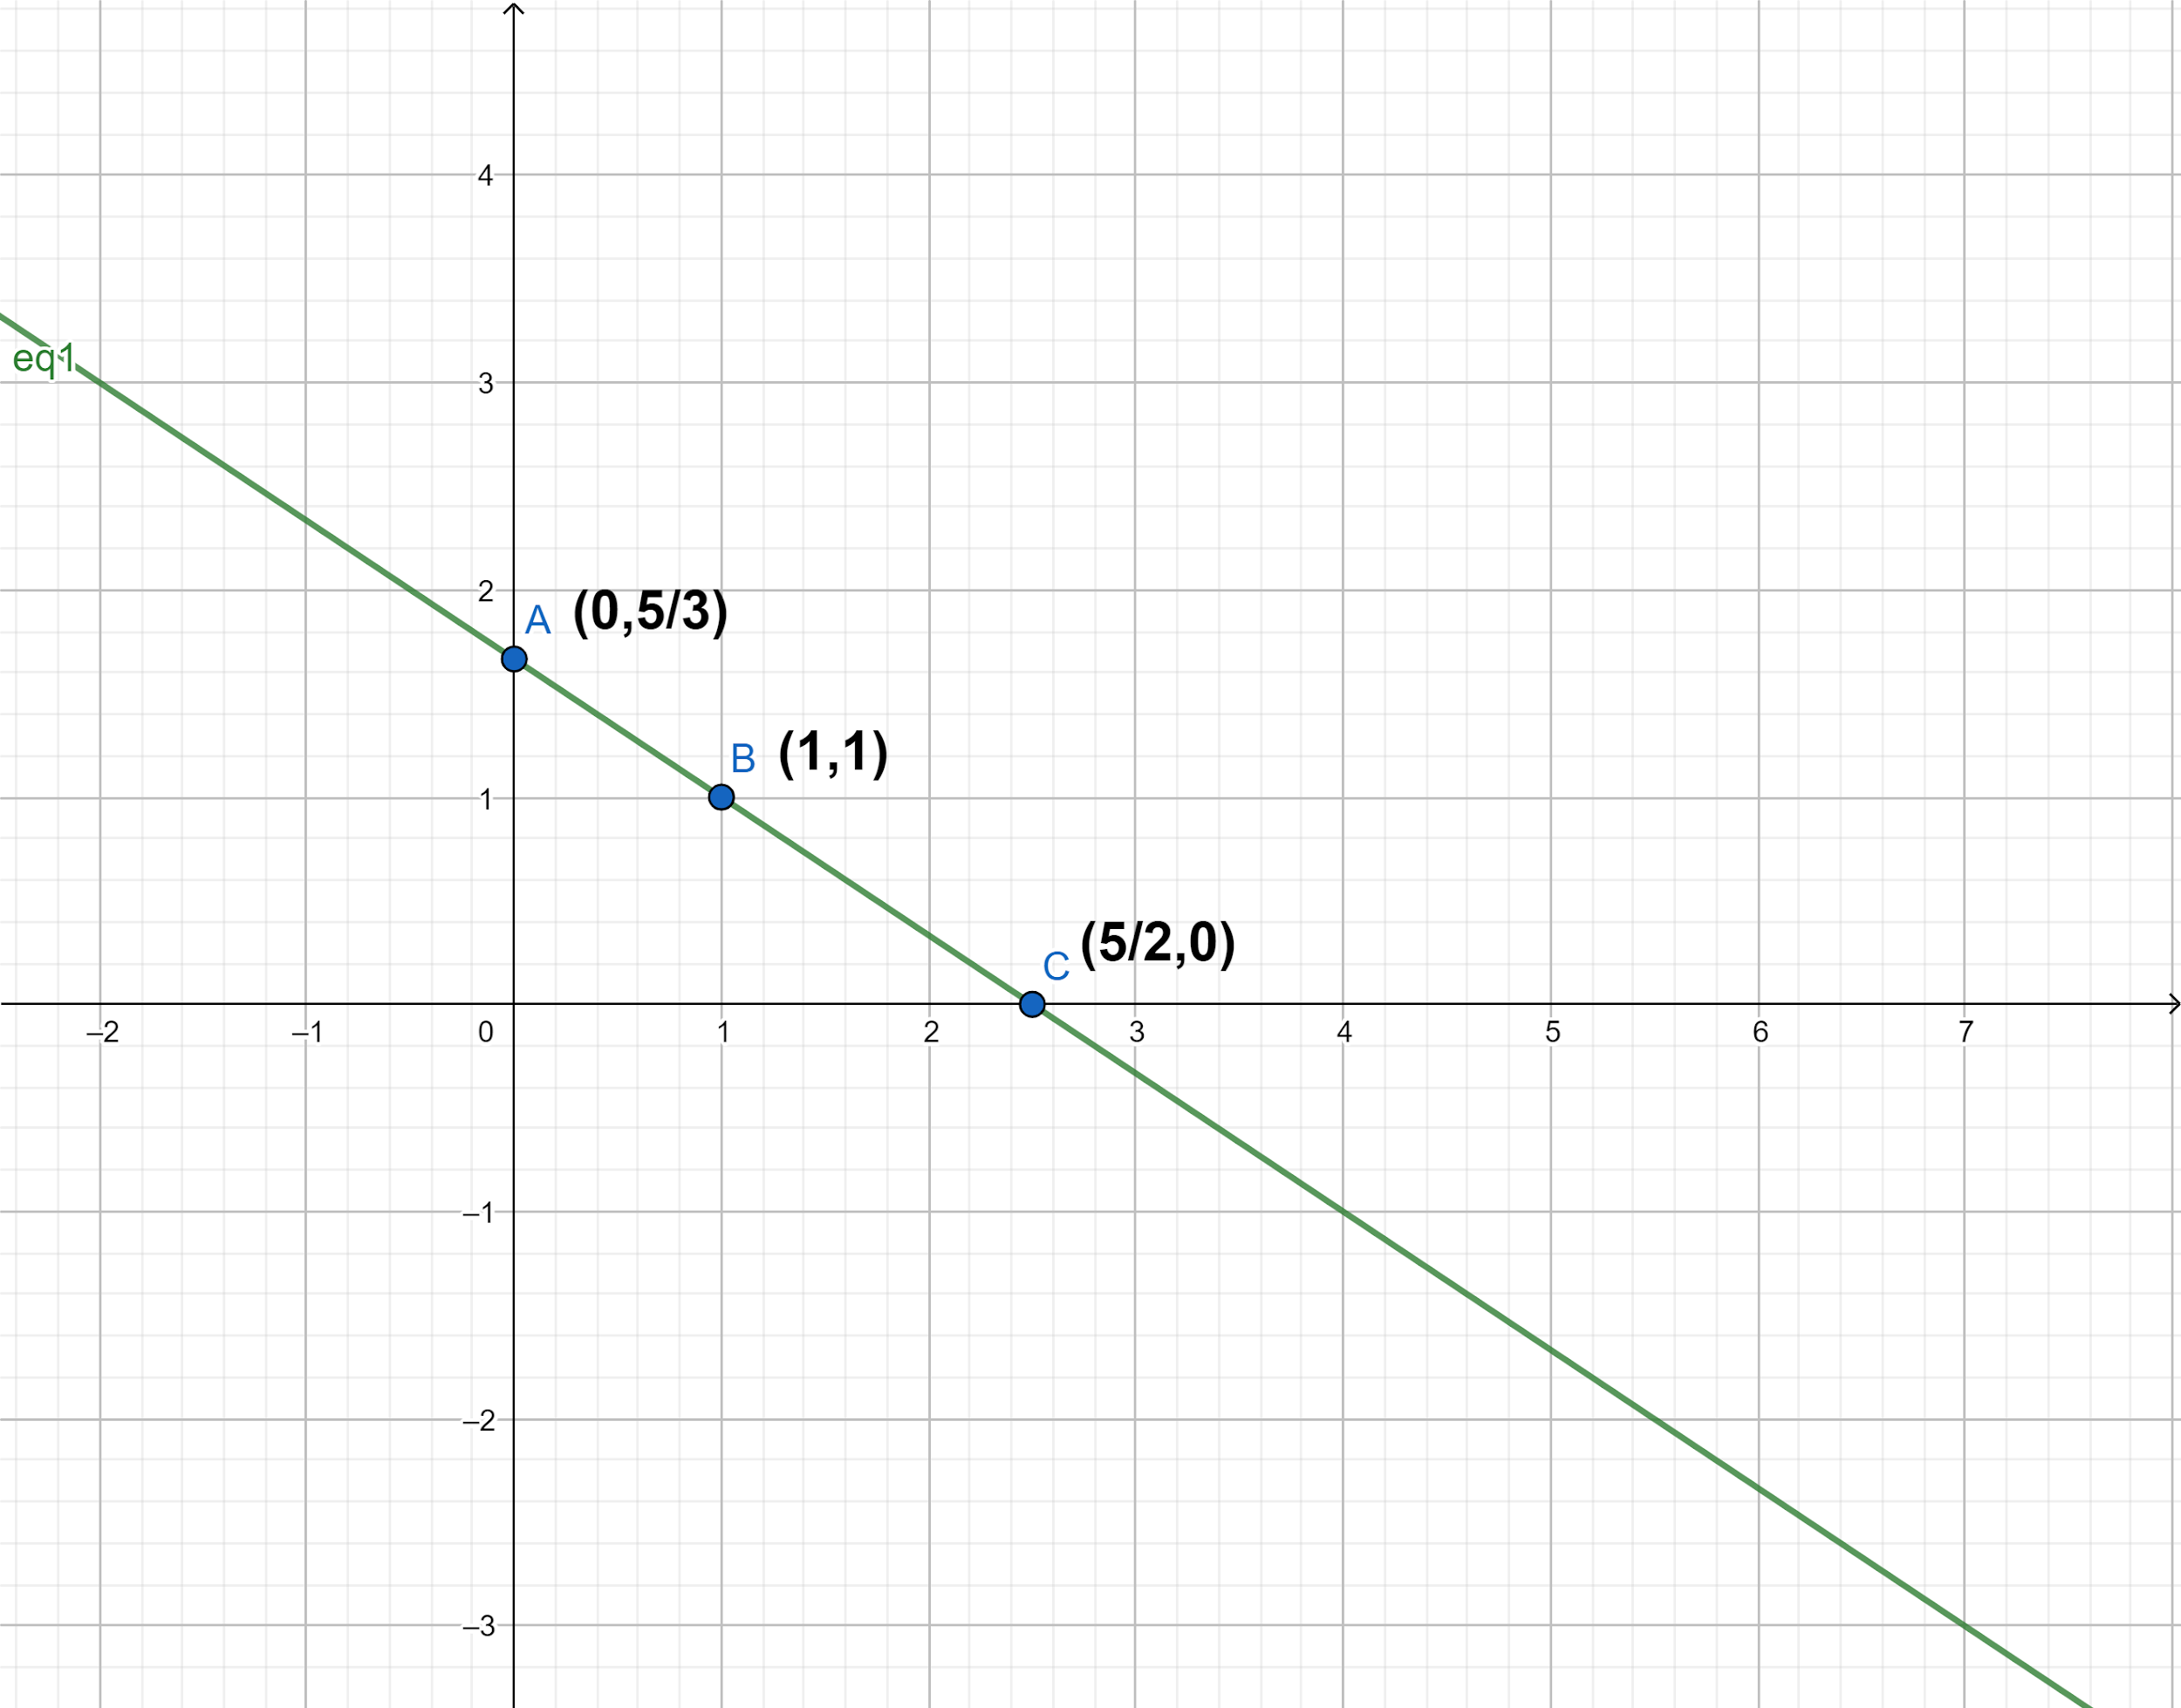
Hence, the graph plotted for the obtained line is represented below:
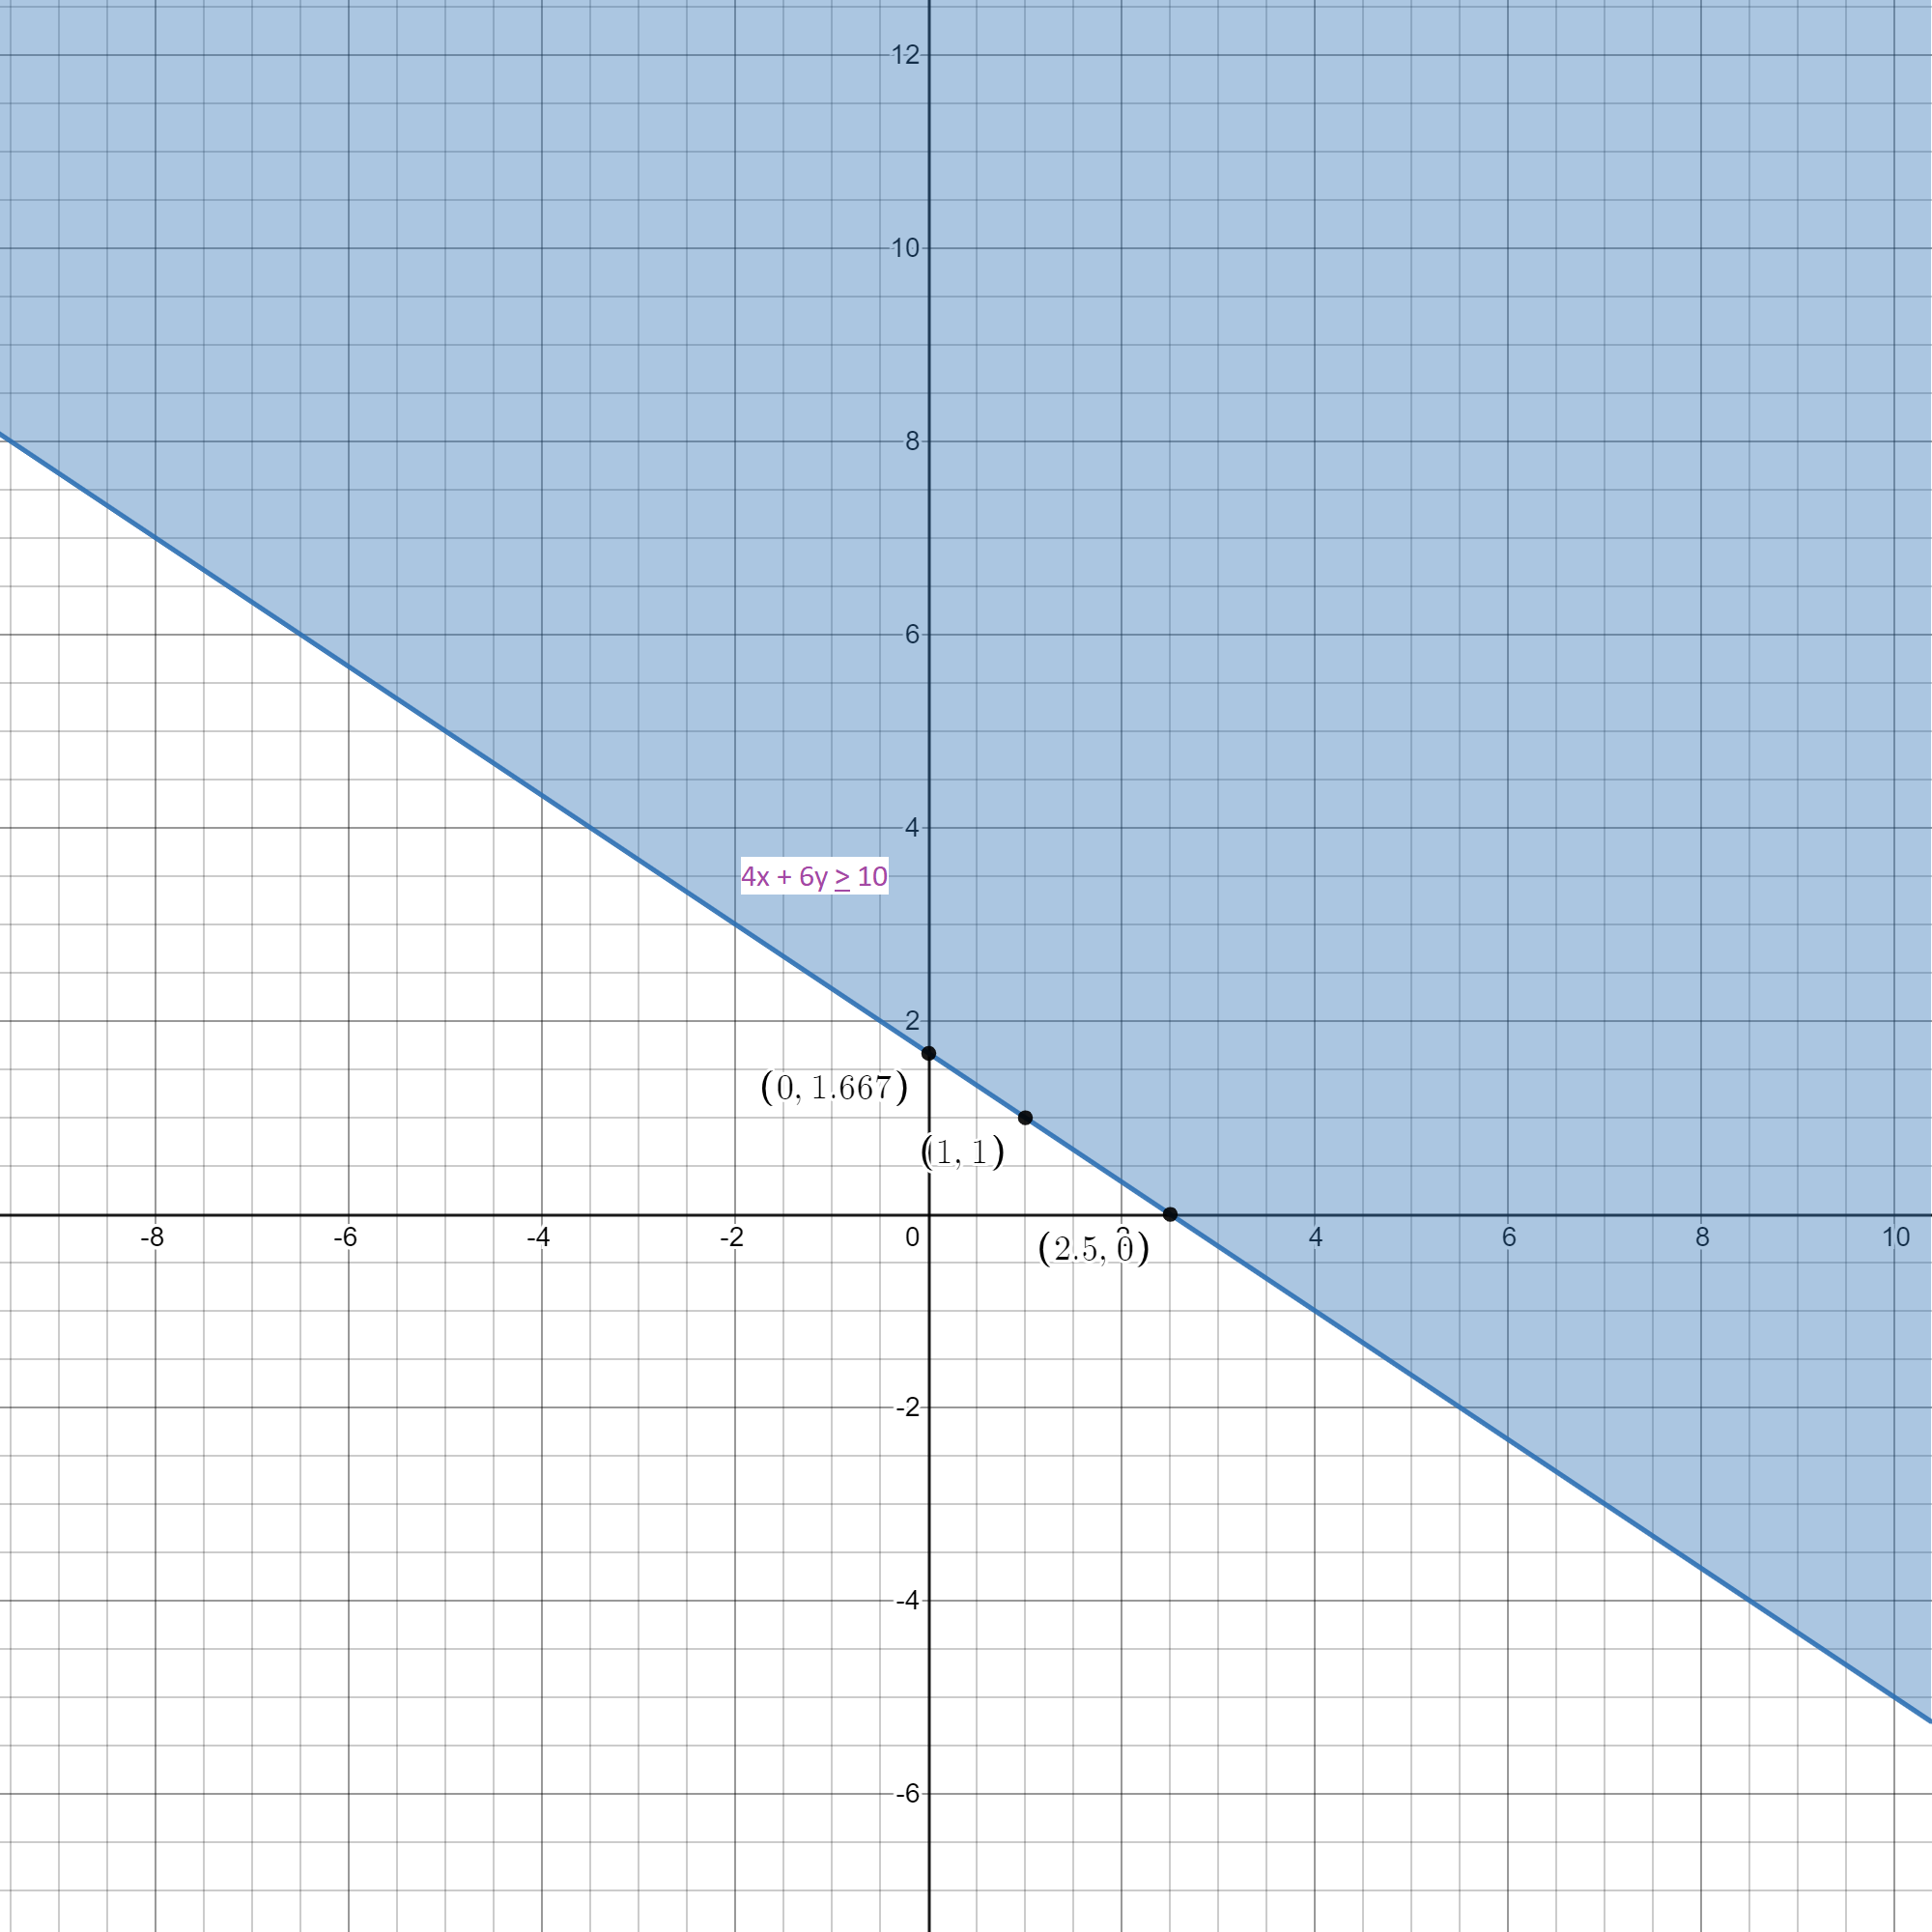
We know that a line divides the Cartesian plane into two halves. After drawing the graph of the line, we choose which half represents the inequality given to us in the problem. We substitute the coordinates of one point lying in both the regions and the region consisting of the point that satisfies the inequality is the graph of that inequality.
So, we check for the coordinates of origin.
Hence, we substitute $\left( {0,0} \right)$ in the inequality.
So, we get,
$ \Rightarrow 4\left( 0 \right) + 6\left( 0 \right) \geqslant 10$
$ \Rightarrow 0 \geqslant 10$
Now, we know that the above expression is false. So, we can conclude that origin does not satisfy the inequality given to us in the problem. Hence, the graph of the inequality consists of the region not consisting of the origin. So, we get the graph of the inequality as:
Note:
The graph plotted is a two dimensional graph in x-axis versus y-axis. This is the easiest way of solving such a question and the solution can be referred to whenever one needs to do any other question of the same type.
Complete step by step solution:
Here in this question, we have to plot the graph for the given inequality.
So, the given inequality is $4x + 6y \geqslant 10$.
Now, we replace the inequality sign with an “equals to” sign so as to get the equation of a line.
So, we get $4x + 6y = 10$.
Now, we have to sketch this line first in order to draw the graph of the required inequality.
So, we have to find the value of y by using the equation $4x + 6y = 10$. Let us substitute the value of x as $0$, $1$, and $\dfrac{5}{2}$.
Now we consider the value of x as $0$, the value of y is
\[ \Rightarrow 4\left( 0 \right) + 6y = 10\]
$ \Rightarrow 6y = 10$
$ \Rightarrow y = \dfrac{{10}}{6} = \dfrac{5}{3}$
Now we consider the value of x as $1$, the value of y is
\[ \Rightarrow 4\left( 1 \right) + 6y = 10\]
\[ \Rightarrow 6y = 10 - 4\]
\[ \Rightarrow 6y = 6\]
\[ \Rightarrow y = \dfrac{6}{6} = 1\]
Now we consider the value of x as $\dfrac{5}{2}$, the value of y is
\[ \Rightarrow 4\left( {\dfrac{5}{2}} \right) + 6y = 10\]
\[ \Rightarrow 10 + 6y = 10\]
\[ \Rightarrow 6y = 10 - 10\]
\[ \Rightarrow 6y = 0\]
\[ \Rightarrow y = 0\]
Now we draw a table for these values we have
| x | $0$ | $1$ | $\dfrac{5}{2}$ |
| y | $\dfrac{5}{3}$ | $1$ | $0$ |
Hence, the graph plotted for the obtained line is represented below:
We know that a line divides the Cartesian plane into two halves. After drawing the graph of the line, we choose which half represents the inequality given to us in the problem. We substitute the coordinates of one point lying in both the regions and the region consisting of the point that satisfies the inequality is the graph of that inequality.
So, we check for the coordinates of origin.
Hence, we substitute $\left( {0,0} \right)$ in the inequality.
So, we get,
$ \Rightarrow 4\left( 0 \right) + 6\left( 0 \right) \geqslant 10$
$ \Rightarrow 0 \geqslant 10$
Now, we know that the above expression is false. So, we can conclude that origin does not satisfy the inequality given to us in the problem. Hence, the graph of the inequality consists of the region not consisting of the origin. So, we get the graph of the inequality as:
Note:
The graph plotted is a two dimensional graph in x-axis versus y-axis. This is the easiest way of solving such a question and the solution can be referred to whenever one needs to do any other question of the same type.

Recently Updated Pages
Basicity of sulphurous acid and sulphuric acid are
Master Class 9 Social Science: Engaging Questions & Answers for Success
Master Class 9 Science: Engaging Questions & Answers for Success
Master Class 9 Maths: Engaging Questions & Answers for Success
Master Class 9 General Knowledge: Engaging Questions & Answers for Success
Class 9 Question and Answer - Your Ultimate Solutions Guide
Trending doubts
Fill the blanks with the suitable prepositions 1 The class 9 english CBSE
Difference Between Plant Cell and Animal Cell
Find the sum of series 1 + 2 + 3 + 4 + 5 + + 100 class 9 maths CBSE
Distinguish between Conventional and nonconventional class 9 social science CBSE
Find the mode and median of the data 13 16 12 14 1-class-9-maths-CBSE
What is pollution? How many types of pollution? Define it