


How do you graph the inequality \[2x + y \leqslant 6\] on the coordinate plane ?
Answer
546.6k+ views
Hint:First we need to draw the graph of the equation \[2x + y = 6\]. We use intercept form to draw the graph. That is we find the coordinate of the given equation lying on the line of x- axis, we can find this by substituting the value of ‘y’ is equal to zero (x-intercept). Similarly we can find the coordinate of the equation lying on the line of y- axis, we can find this by substituting the value of ‘x’ equal to zero (y-intercept). After drawing the graph we can check in which region the inequality satisfies.
Complete step by step answer:
Given, \[2x + y \leqslant 6\]. Now consider \[2x + y = 6\]. To find the x-intercept. That is the value of ‘x’ at\[y = 0\]. Substituting this in the given equation. We have,
\[2x + 0 = 6\]
\[\Rightarrow 2x = 6\]
Divide by 2 on both side,
\[x = \dfrac{6}{2}\]
\[ \Rightarrow x = 3\]
Thus we have a coordinate of the equation which lies on the line of x-axis. The coordinate is \[(3,0)\]. To find the y-intercept. That is the value of ‘y’ at \[x = 0\]. Substituting this in the given equation we have,
\[2(0) + y = 6\]
\[ \Rightarrow y = 6\]
Thus we have a coordinate of the equation which lies on the line of y-axis. The coordinate is \[(0,6)\]. Thus we have the coordinates \[(3,0)\] and \[(0,6)\]. Let’s plot a graph for these coordinates. We take scale x-axis= 1 unit = 1 units and y-axis= 1 unit = 1 units.
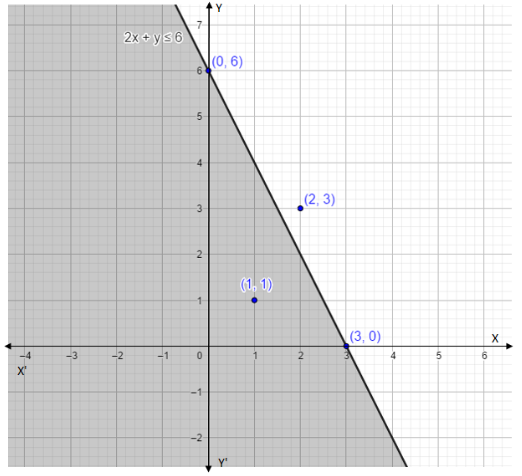
We expanded the point touching the intercepts. We took a coordinate above and below the equation of line (see in above graph).
That is \[(x,y) = (2,3)\] and now put it in the inequality,
\[2(2) + (3) \leqslant 6\]
\[4 + 3 \leqslant 6\]
\[ \Rightarrow 7 \leqslant 6\]. Which is wrong.
Now take a coordinate below the equation of line,
That is \[(x,y) = (1,1)\]
\[2(1) + 1 \leqslant 6\]
\[2 + 1 \leqslant 6\]
\[ \Rightarrow 3 \leqslant 6\]. Which is true.
In the above graph the shaded region is the solution of the given inequality.
Note:If we take any coordinate point below the line of the graph, the inequality satisfies. Also if we take a point on the line, the inequality will be satisfied. A graph shows the relation between two variable quantities, it contains two axes perpendicular to each other namely the x-axis and the y-axis. Each variable is measured along one of the axes. In the question, we are given one linear equation containing two variables namely x and y, x is measured along the x-axis and y is measured along the y-axis while tracing the given equations.
Complete step by step answer:
Given, \[2x + y \leqslant 6\]. Now consider \[2x + y = 6\]. To find the x-intercept. That is the value of ‘x’ at\[y = 0\]. Substituting this in the given equation. We have,
\[2x + 0 = 6\]
\[\Rightarrow 2x = 6\]
Divide by 2 on both side,
\[x = \dfrac{6}{2}\]
\[ \Rightarrow x = 3\]
Thus we have a coordinate of the equation which lies on the line of x-axis. The coordinate is \[(3,0)\]. To find the y-intercept. That is the value of ‘y’ at \[x = 0\]. Substituting this in the given equation we have,
\[2(0) + y = 6\]
\[ \Rightarrow y = 6\]
Thus we have a coordinate of the equation which lies on the line of y-axis. The coordinate is \[(0,6)\]. Thus we have the coordinates \[(3,0)\] and \[(0,6)\]. Let’s plot a graph for these coordinates. We take scale x-axis= 1 unit = 1 units and y-axis= 1 unit = 1 units.
We expanded the point touching the intercepts. We took a coordinate above and below the equation of line (see in above graph).
That is \[(x,y) = (2,3)\] and now put it in the inequality,
\[2(2) + (3) \leqslant 6\]
\[4 + 3 \leqslant 6\]
\[ \Rightarrow 7 \leqslant 6\]. Which is wrong.
Now take a coordinate below the equation of line,
That is \[(x,y) = (1,1)\]
\[2(1) + 1 \leqslant 6\]
\[2 + 1 \leqslant 6\]
\[ \Rightarrow 3 \leqslant 6\]. Which is true.
In the above graph the shaded region is the solution of the given inequality.
Note:If we take any coordinate point below the line of the graph, the inequality satisfies. Also if we take a point on the line, the inequality will be satisfied. A graph shows the relation between two variable quantities, it contains two axes perpendicular to each other namely the x-axis and the y-axis. Each variable is measured along one of the axes. In the question, we are given one linear equation containing two variables namely x and y, x is measured along the x-axis and y is measured along the y-axis while tracing the given equations.
Recently Updated Pages
Master Class 11 English: Engaging Questions & Answers for Success
Master Class 11 Maths: Engaging Questions & Answers for Success
Master Class 11 Biology: Engaging Questions & Answers for Success
Master Class 11 Physics: Engaging Questions & Answers for Success
Master Class 11 Accountancy: Engaging Questions & Answers for Success
Class 11 Question and Answer - Your Ultimate Solutions Guide
Trending doubts
One Metric ton is equal to kg A 10000 B 1000 C 100 class 11 physics CBSE
Discuss the various forms of bacteria class 11 biology CBSE
Draw a diagram of a plant cell and label at least eight class 11 biology CBSE
State the laws of reflection of light
Explain zero factorial class 11 maths CBSE
10 examples of friction in our daily life