


How do you graph the function $ y = - \dfrac{1}{4}{x^2} + 3 $ and identify the domain and range ?
Answer
524.4k+ views
Hint: A graph of a function f is the set of ordered pairs; the equation of graph is generally represented as $ y = f\left( x \right) $ , where x and $ f\left( x \right) $ are real numbers. We substitute the value of x and we determine the value of y and then we mark the points in the graph and we join the points.
Complete step by step solution:
Here, in the given question, we have to plot the graph for the given function. A graph of a function is set of ordered pairs and it is represented as $ y = f\left( x \right) $ , where x and $ f\left( x \right) $ are real numbers. These pairs are in the form of Cartesian form and the graph is the two-dimensional graph.
First, we have to find the value of y by using the graph equation $ y = - \dfrac{1}{4}{x^2} + 3 $ .
So, before substituting the values of x in the function, we need to know the domain and range of the function given to us.
So, there is no restriction on the values of x that we can put in the function $ y = - \dfrac{1}{4}{x^2} + 3 $ . So, the domain of the function $ y = - \dfrac{1}{4}{x^2} + 3 $ is the set of real numbers.
Now, for finding the range of the function, we have to express x in terms of y and then see the values that y can take.
So, $ y = - \dfrac{1}{4}{x^2} + 3 $
Shifting the terms in the equation so as to find value of x in terms of y, we get,
$ \Rightarrow \dfrac{1}{4}{x^2} = 3 - y $
Multiplying both sides of the equation by $ 4 $ ,
$ \Rightarrow {x^2} = 4\left( {3 - y} \right) $
$ \Rightarrow x = \pm \sqrt {4\left( {3 - y} \right)} $
Taking $ 4 $ outside the square root, we get,
$ \Rightarrow x = \pm 2\sqrt {\left( {3 - y} \right)} $
So, the term inside the bracket should be positive. So, $ \left( {3 - y} \right) \geqslant 0 $
$ \Rightarrow y \leqslant 3 $
Let us substitute the value of x as $ 2 $ .
$ \Rightarrow y = - \dfrac{1}{4}{\left( 2 \right)^2} + 3 $
Calculating the square of $ 2 $ , we get,
$ \Rightarrow y = - \dfrac{1}{4}\left( 4 \right) + 3 $
Simplifying further, we get,
$ \Rightarrow y = - 1 + 3 $
$ \Rightarrow y = 2 $
Now we consider the value of x as $ 4 $ , the value of y is
$ \Rightarrow y = - \dfrac{1}{4}{\left( 4 \right)^2} + 3 $
Calculating the square of $ 4 $ , we get,
$ \Rightarrow y = - \dfrac{1}{4}\left( {16} \right) + 3 $
Simplifying further, we get,
$ \Rightarrow y = - 4 + 3 $
$ \Rightarrow y = - 1 $
Now we consider the value of x as $ 0 $ , the value of y is
$ \Rightarrow y = - \dfrac{1}{4}{\left( 0 \right)^2} + 3 $
Simplifying further, we get,
$ \Rightarrow y = 0 + 3 $
$ \Rightarrow y = 3 $
Now we draw a table for these values we have
We also know the nature of the graph of sine function. Hence, we can now plot the graph of the given function $ y = - \dfrac{1}{4}{x^2} + 3 $ . The nature of the graph of a function and its slope can also be determined from the derivative of the function. The graph plotted for these points is represented below:
Note: The graph is plotted x-axis versus y axis. The graph is two dimensional. By the equation of a graph, we can plot the graph by assuming the value of x. We can’t assume the value of y. because the value of y depends on the value of x. Hence, we have plotted the graph.
Complete step by step solution:
Here, in the given question, we have to plot the graph for the given function. A graph of a function is set of ordered pairs and it is represented as $ y = f\left( x \right) $ , where x and $ f\left( x \right) $ are real numbers. These pairs are in the form of Cartesian form and the graph is the two-dimensional graph.
First, we have to find the value of y by using the graph equation $ y = - \dfrac{1}{4}{x^2} + 3 $ .
So, before substituting the values of x in the function, we need to know the domain and range of the function given to us.
So, there is no restriction on the values of x that we can put in the function $ y = - \dfrac{1}{4}{x^2} + 3 $ . So, the domain of the function $ y = - \dfrac{1}{4}{x^2} + 3 $ is the set of real numbers.
Now, for finding the range of the function, we have to express x in terms of y and then see the values that y can take.
So, $ y = - \dfrac{1}{4}{x^2} + 3 $
Shifting the terms in the equation so as to find value of x in terms of y, we get,
$ \Rightarrow \dfrac{1}{4}{x^2} = 3 - y $
Multiplying both sides of the equation by $ 4 $ ,
$ \Rightarrow {x^2} = 4\left( {3 - y} \right) $
$ \Rightarrow x = \pm \sqrt {4\left( {3 - y} \right)} $
Taking $ 4 $ outside the square root, we get,
$ \Rightarrow x = \pm 2\sqrt {\left( {3 - y} \right)} $
So, the term inside the bracket should be positive. So, $ \left( {3 - y} \right) \geqslant 0 $
$ \Rightarrow y \leqslant 3 $
Let us substitute the value of x as $ 2 $ .
$ \Rightarrow y = - \dfrac{1}{4}{\left( 2 \right)^2} + 3 $
Calculating the square of $ 2 $ , we get,
$ \Rightarrow y = - \dfrac{1}{4}\left( 4 \right) + 3 $
Simplifying further, we get,
$ \Rightarrow y = - 1 + 3 $
$ \Rightarrow y = 2 $
Now we consider the value of x as $ 4 $ , the value of y is
$ \Rightarrow y = - \dfrac{1}{4}{\left( 4 \right)^2} + 3 $
Calculating the square of $ 4 $ , we get,
$ \Rightarrow y = - \dfrac{1}{4}\left( {16} \right) + 3 $
Simplifying further, we get,
$ \Rightarrow y = - 4 + 3 $
$ \Rightarrow y = - 1 $
Now we consider the value of x as $ 0 $ , the value of y is
$ \Rightarrow y = - \dfrac{1}{4}{\left( 0 \right)^2} + 3 $
Simplifying further, we get,
$ \Rightarrow y = 0 + 3 $
$ \Rightarrow y = 3 $
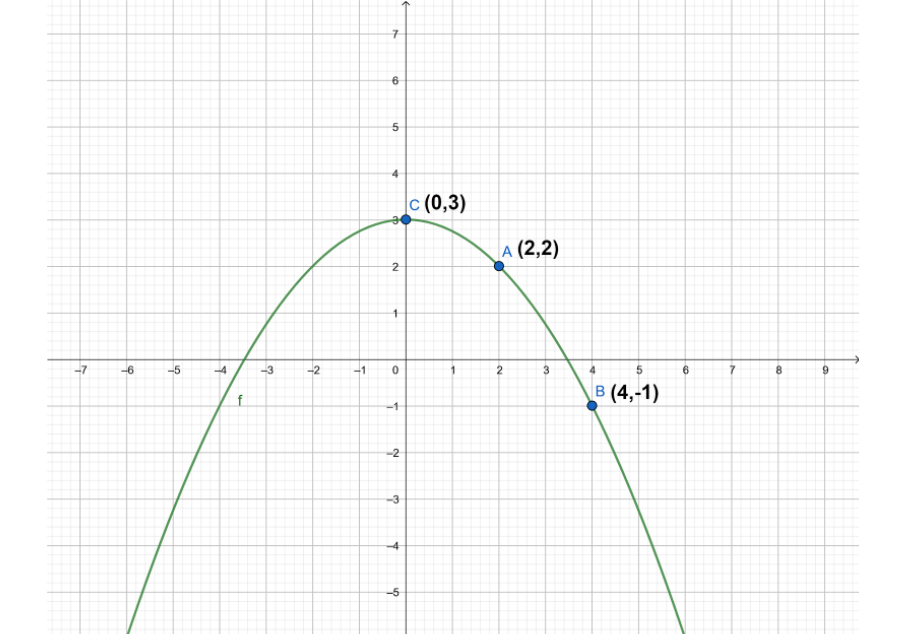
Now we draw a table for these values we have
| X | $ 2 $ | $ 4 $ | $ 0 $ |
| y | $ 2 $ | $ - 1 $ | $ 3 $ |
We also know the nature of the graph of sine function. Hence, we can now plot the graph of the given function $ y = - \dfrac{1}{4}{x^2} + 3 $ . The nature of the graph of a function and its slope can also be determined from the derivative of the function. The graph plotted for these points is represented below:
Note: The graph is plotted x-axis versus y axis. The graph is two dimensional. By the equation of a graph, we can plot the graph by assuming the value of x. We can’t assume the value of y. because the value of y depends on the value of x. Hence, we have plotted the graph.

Recently Updated Pages
Master Class 11 English: Engaging Questions & Answers for Success
Master Class 11 Maths: Engaging Questions & Answers for Success
Master Class 11 Biology: Engaging Questions & Answers for Success
Master Class 11 Physics: Engaging Questions & Answers for Success
Master Class 11 Accountancy: Engaging Questions & Answers for Success
Class 11 Question and Answer - Your Ultimate Solutions Guide
Trending doubts
What is BLO What is the full form of BLO class 8 social science CBSE
What are the 12 elements of nature class 8 chemistry CBSE
Citizens of India can vote at the age of A 18 years class 8 social science CBSE
Full form of STD, ISD and PCO
Convert 40circ C to Fahrenheit A 104circ F B 107circ class 8 maths CBSE
Advantages and disadvantages of science