


How do you graph the function $f\left( x \right)=2x$ ?
Answer
582.3k+ views
Hint: Problems of this type can be easily solved by converting the function into a simple coordinate geometrical equation first, as $y=2x$ . After that we select two $x$ values, and plug them into the equation to find the corresponding $y$ values. Now, we plot the two points on graph paper and connect them using a line, which will be the graph of the given function.
Complete step by step answer:
The given function we have is
$f\left( x \right)=2x$
We rewrite this function in the form of an equation,
$\Rightarrow y=2x$
As, this is an equation of a straight line and we know that any line can be graphed connecting two points. We have to select two $x$ values, and plug them into the equation to find the corresponding $y$ values.
We now choose $0$ to substitute in for in for $x$ to find the ordered pair. Replacing the variable $x$ with $0$ in the expression, we get
$\Rightarrow f\left( 0 \right)=2\cdot 0$
$\Rightarrow f\left( 0 \right)=0$
$\Rightarrow y=0$
Hence, for $x=0$ we get $0$ as the $y$ value.
Again, we replace the variable $x$ with $5$ in the expression, as
$\Rightarrow f\left( 5 \right)=2\cdot 5$
$\Rightarrow f\left( 5 \right)=10$
$\Rightarrow y=10$
Hence, for $x=5$ we get $10$ as the $y$ value.
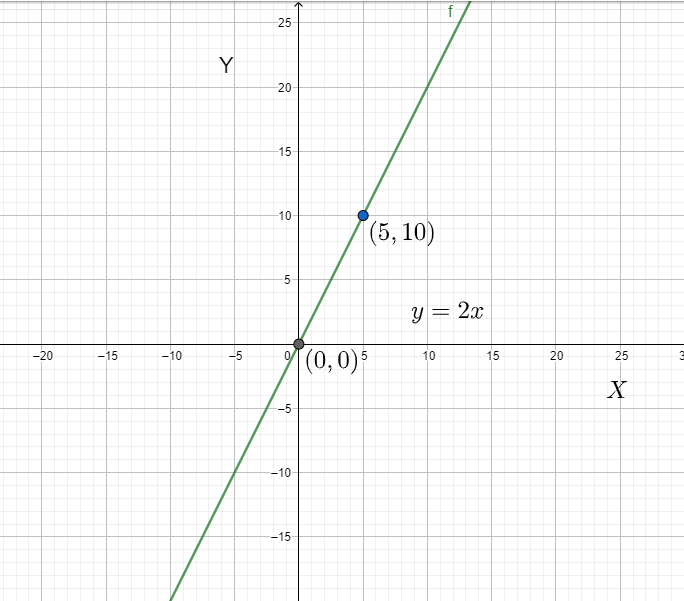
We get the coordinates of the two points $\left( 0,0 \right)$ and $\left( 5,10 \right)$
Now, connecting the two points we get the graph of the line, $y=2x$
Therefore, we graph the line by connecting the points $\left( 0,0 \right)$ and $\left( 5,10 \right)$ .
Note:
Instead of connecting two points to get the line we can also graph the function by comparing the equation with the general straight-line equation, $y=mx+c$ . Hence, the slope we get is $2$ and the $y$ intercept is $0$ . As the line has zero $y$ intercept using a protractor at the origin to draw the angle of the corresponding slope, we will be able to plot the function $f\left( x \right)=2x$ on graph paper.
Complete step by step answer:
The given function we have is
$f\left( x \right)=2x$
We rewrite this function in the form of an equation,
$\Rightarrow y=2x$
As, this is an equation of a straight line and we know that any line can be graphed connecting two points. We have to select two $x$ values, and plug them into the equation to find the corresponding $y$ values.
We now choose $0$ to substitute in for in for $x$ to find the ordered pair. Replacing the variable $x$ with $0$ in the expression, we get
$\Rightarrow f\left( 0 \right)=2\cdot 0$
$\Rightarrow f\left( 0 \right)=0$
$\Rightarrow y=0$
Hence, for $x=0$ we get $0$ as the $y$ value.
Again, we replace the variable $x$ with $5$ in the expression, as
$\Rightarrow f\left( 5 \right)=2\cdot 5$
$\Rightarrow f\left( 5 \right)=10$
$\Rightarrow y=10$
Hence, for $x=5$ we get $10$ as the $y$ value.
We get the coordinates of the two points $\left( 0,0 \right)$ and $\left( 5,10 \right)$
Now, connecting the two points we get the graph of the line, $y=2x$
Therefore, we graph the line by connecting the points $\left( 0,0 \right)$ and $\left( 5,10 \right)$ .
Note:
Instead of connecting two points to get the line we can also graph the function by comparing the equation with the general straight-line equation, $y=mx+c$ . Hence, the slope we get is $2$ and the $y$ intercept is $0$ . As the line has zero $y$ intercept using a protractor at the origin to draw the angle of the corresponding slope, we will be able to plot the function $f\left( x \right)=2x$ on graph paper.
Recently Updated Pages
Master Class 11 Social Science: Engaging Questions & Answers for Success
Master Class 11 English: Engaging Questions & Answers for Success
Master Class 11 Maths: Engaging Questions & Answers for Success
Master Class 11 Chemistry: Engaging Questions & Answers for Success
Master Class 11 Biology: Engaging Questions & Answers for Success
Master Class 11 Physics: Engaging Questions & Answers for Success
Trending doubts
One Metric ton is equal to kg A 10000 B 1000 C 100 class 11 physics CBSE
Difference Between Prokaryotic Cells and Eukaryotic Cells
Draw a diagram of a plant cell and label at least eight class 11 biology CBSE
Two of the body parts which do not appear in MRI are class 11 biology CBSE
Which gas is abundant in air class 11 chemistry CBSE
10 examples of friction in our daily life