


Graph the following inequalities, \[x \geqslant 0\], \[y \geqslant 0\]
Answer
568.2k+ views
Hint: Inequalities are not lines but regions on the graph. Unlike equations, they don’t usually need plotting of points. Whenever there are more than one inequality to be plotted on the graph, find the regions individually and then combine them to get the resulting graph. This would avoid errors.
Complete step by step answer:
Let us understand exactly what the given inequalities represent individually, before we graph them.
We know that a Cartesian plane has 4 different quadrants, where quadrant I and II have y values as positive and quadrant III and IV have y values as negative.
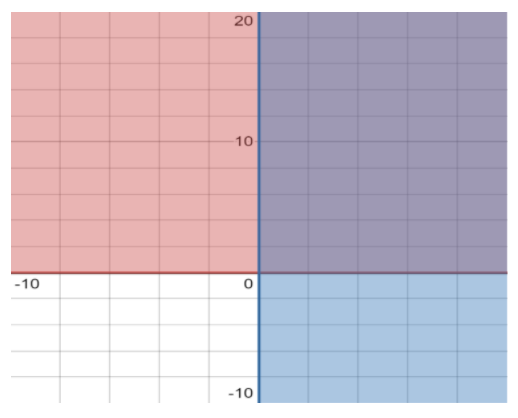
\[x \geqslant 0\]means that x is greater than or equal to zero, implying that it can never be negative. It is everything on and to the right of the y-axis (where \[x = 0\])
\[y \geqslant 0\]means that y is greater than or equal to zero, implying that it can’t be negative either. It is everything on and above the x-axis (where \[y = 0\])
Combining both the inequalities, \[x \geqslant 0\]and \[y \geqslant 0\] the solution set will be everything in the upper right quadrant of the Cartesian plane including the positive x and y axes (and the point \[(0,0)\]).
The graph resulting from the above inference will not be a line or a circle or any shape for that matter, but it will be a region.
The graph, hence, will look like,
Note: The best way to plot an inequality in two variables is by shifting all the terms with one variable on the left and taking all the terms with the other variable to the right. Segregating the terms makes it easier to plot graphs. This way is more apt when plotting graphs for bigger functions.
Complete step by step answer:
Let us understand exactly what the given inequalities represent individually, before we graph them.
We know that a Cartesian plane has 4 different quadrants, where quadrant I and II have y values as positive and quadrant III and IV have y values as negative.
\[x \geqslant 0\]means that x is greater than or equal to zero, implying that it can never be negative. It is everything on and to the right of the y-axis (where \[x = 0\])
\[y \geqslant 0\]means that y is greater than or equal to zero, implying that it can’t be negative either. It is everything on and above the x-axis (where \[y = 0\])
Combining both the inequalities, \[x \geqslant 0\]and \[y \geqslant 0\] the solution set will be everything in the upper right quadrant of the Cartesian plane including the positive x and y axes (and the point \[(0,0)\]).
The graph resulting from the above inference will not be a line or a circle or any shape for that matter, but it will be a region.
The graph, hence, will look like,
Note: The best way to plot an inequality in two variables is by shifting all the terms with one variable on the left and taking all the terms with the other variable to the right. Segregating the terms makes it easier to plot graphs. This way is more apt when plotting graphs for bigger functions.

Recently Updated Pages
Master Class 10 Computer Science: Engaging Questions & Answers for Success
Master Class 10 General Knowledge: Engaging Questions & Answers for Success
Master Class 10 English: Engaging Questions & Answers for Success
Master Class 10 Social Science: Engaging Questions & Answers for Success
Master Class 10 Maths: Engaging Questions & Answers for Success
Master Class 10 Science: Engaging Questions & Answers for Success
Trending doubts
Find the sum of series 1 + 2 + 3 + 4 + 5 + + 100 class 9 maths CBSE
Fill the blanks with the suitable prepositions 1 The class 9 english CBSE
Difference Between Plant Cell and Animal Cell
What is the Full Form of ICSE / ISC ?
What is pollution? How many types of pollution? Define it
Name 10 Living and Non living things class 9 biology CBSE