


How do you graph the following equation and identity y-intercept \[2y+3x=-2\]?
Answer
586.5k+ views
Hint: We are asked to draw the graph of the equation \[2y+3x=-2\]. The degree of an equation is the highest power of the variable present in it. So, for this equation, the highest power present \[x\] is 1, the degree is also 1. From this, it can be said that this is a linear equation. The graph of a linear equation represents a straight line.
Complete step-by-step solution:
The general equation of a straight line is \[ax+by+c=0\], where \[a,b,c\] are any real numbers. The given equation is \[2y+3x=-2\], the equation can also be written as \[3x+2y+2=0\], comparing with the general equation of straight line, we get \[a=3,b=2\And c=2\].
To plot the graph of an equation of the straight line, we should know at least two points, through which the line passes.
To make things simple, let’s take the X-intercept and Y-intercept as the two points. X-intercept is the point where the line crosses X-axis, this means that the Y-coordinate will be \[0\], similarly Y-intercept is the point where the line crosses Y-axis, so X-coordinate will be \[0\]. We will use this property now.
We substitute \[y=0\] in the equation \[3x+2y+2=0\], we get
\[\begin{align}
& \Rightarrow 3x+2(0)+2=0 \\
& \Rightarrow 3x+2=0 \\
\end{align}\]
Subtracting 2 from both sides of the equation we get,
\[\begin{align}
& \Rightarrow 3x+2-2=0-2 \\
& \Rightarrow 3x=-2 \\
\end{align}\]
We divide 3 to both sides we get,
\[\begin{align}
& \Rightarrow \dfrac{3x}{3}=\dfrac{-2}{3} \\
& \therefore x=\dfrac{-2}{3} \\
\end{align}\]
So, the coordinates of the X-intercept are \[\left( \dfrac{-2}{3},0 \right)\].
Similarly, now we substitute \[x=0\] in the equation, we get
\[\begin{align}
& \Rightarrow 3(0)+2y+2=0 \\
& \Rightarrow 2y+2=0 \\
\end{align}\]
Subtracting 2 from both sides of the equation, we get
\[\begin{align}
& \Rightarrow 2y+2-2=0-2 \\
& \Rightarrow 2y=-2 \\
\end{align}\]
Dividing both sides of above equation by 2, we get
\[\begin{align}
& \Rightarrow \dfrac{2y}{2}=\dfrac{-2}{2} \\
& \therefore y=-1 \\
\end{align}\]
So, the coordinates of the Y-intercept are \[\left( 0,-1 \right)\].
Thus, we get the Y-intercept of the line as \[-1\].
Using these two points we can plot the graph of the equation as follows:
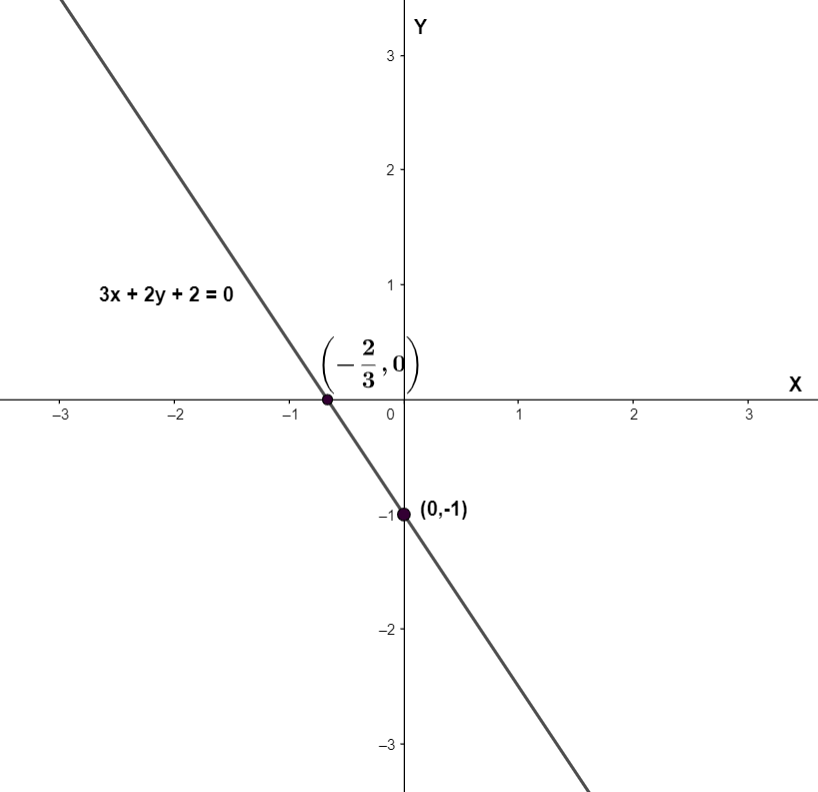
We can identify the Y-intercept from the graph as the point where the line crosses the Y-axis.
Note: Here, we found the two points which are X-intercept and Y-intercept by substituting either x or \[y\] to be zero, one at a time. We can also find these values by converting the straight-line equation to the equation in intercept form which is, \[\dfrac{x}{a}+\dfrac{y}{b}=1\]. Here, \[a\And b\] are X-intercept and Y-intercept respectively.
Complete step-by-step solution:
The general equation of a straight line is \[ax+by+c=0\], where \[a,b,c\] are any real numbers. The given equation is \[2y+3x=-2\], the equation can also be written as \[3x+2y+2=0\], comparing with the general equation of straight line, we get \[a=3,b=2\And c=2\].
To plot the graph of an equation of the straight line, we should know at least two points, through which the line passes.
To make things simple, let’s take the X-intercept and Y-intercept as the two points. X-intercept is the point where the line crosses X-axis, this means that the Y-coordinate will be \[0\], similarly Y-intercept is the point where the line crosses Y-axis, so X-coordinate will be \[0\]. We will use this property now.
We substitute \[y=0\] in the equation \[3x+2y+2=0\], we get
\[\begin{align}
& \Rightarrow 3x+2(0)+2=0 \\
& \Rightarrow 3x+2=0 \\
\end{align}\]
Subtracting 2 from both sides of the equation we get,
\[\begin{align}
& \Rightarrow 3x+2-2=0-2 \\
& \Rightarrow 3x=-2 \\
\end{align}\]
We divide 3 to both sides we get,
\[\begin{align}
& \Rightarrow \dfrac{3x}{3}=\dfrac{-2}{3} \\
& \therefore x=\dfrac{-2}{3} \\
\end{align}\]
So, the coordinates of the X-intercept are \[\left( \dfrac{-2}{3},0 \right)\].
Similarly, now we substitute \[x=0\] in the equation, we get
\[\begin{align}
& \Rightarrow 3(0)+2y+2=0 \\
& \Rightarrow 2y+2=0 \\
\end{align}\]
Subtracting 2 from both sides of the equation, we get
\[\begin{align}
& \Rightarrow 2y+2-2=0-2 \\
& \Rightarrow 2y=-2 \\
\end{align}\]
Dividing both sides of above equation by 2, we get
\[\begin{align}
& \Rightarrow \dfrac{2y}{2}=\dfrac{-2}{2} \\
& \therefore y=-1 \\
\end{align}\]
So, the coordinates of the Y-intercept are \[\left( 0,-1 \right)\].
Thus, we get the Y-intercept of the line as \[-1\].
Using these two points we can plot the graph of the equation as follows:
We can identify the Y-intercept from the graph as the point where the line crosses the Y-axis.
Note: Here, we found the two points which are X-intercept and Y-intercept by substituting either x or \[y\] to be zero, one at a time. We can also find these values by converting the straight-line equation to the equation in intercept form which is, \[\dfrac{x}{a}+\dfrac{y}{b}=1\]. Here, \[a\And b\] are X-intercept and Y-intercept respectively.
Recently Updated Pages
Master Class 12 Economics: Engaging Questions & Answers for Success
Master Class 12 English: Engaging Questions & Answers for Success
Master Class 12 Social Science: Engaging Questions & Answers for Success
Master Class 12 Maths: Engaging Questions & Answers for Success
Master Class 12 Physics: Engaging Questions & Answers for Success
Master Class 9 General Knowledge: Engaging Questions & Answers for Success
Trending doubts
One Metric ton is equal to kg A 10000 B 1000 C 100 class 11 physics CBSE
Difference Between Prokaryotic Cells and Eukaryotic Cells
Find the value of the expression given below sin 30circ class 11 maths CBSE
Two of the body parts which do not appear in MRI are class 11 biology CBSE
Draw a diagram of nephron and explain its structur class 11 biology CBSE
10 examples of friction in our daily life