


How do you graph the equation $y=\dfrac{5}{3}x+4$ .
Answer
606k+ views
Hint: Now we are given a linear equation in two variables. First we will find some of the solutions of the equation. To find some solutions we will substitute random values of x and then get the corresponding value of y. Hence we will get (x, y) such that it will satisfy the equation. Now we will plot these points and draw a line passing through all these points Hence this is the graph of the given equation.
Complete step-by-step answer:
Consider the given equation $y=\dfrac{5}{3}x+4$ . This equation is a linear equation in two variables.
Now to plot the graph of this equation we will need to find some of the solutions of the given equation.
To find the solutions we will substitute the values of x in the equation and find the corresponding values of y.
Let us first substitute x = 3 Hence we get y = 9.
Similarly if we substitute x = 6 we get y =14.
Now again let us substitute x = - 3 then we get y = - 1.
Now let us make a table of the values of x and corresponding values of y which satisfies the equation.
Hence we have (3, 9), (6, 14) and (-3, -1) satisfy the given equation.
Now let us plot these points on a graph and draw a line passing through all the points.
Hence we have a graph of the given equation.
Note: Now note when we substitute x = 0 the corresponding value of y is called y intercept. y intercept is the intersection of the line and y axis. Similarly if we substitute y = 0 then we get x intercept which is the intersection of line and x axis. Also choose the value of x wisely so that we get y as an integer and it is easy to plot on the graph.
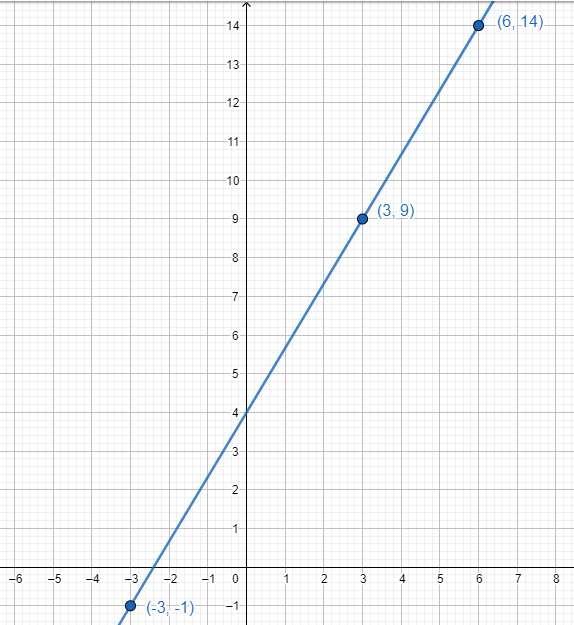
Complete step-by-step answer:
Consider the given equation $y=\dfrac{5}{3}x+4$ . This equation is a linear equation in two variables.
Now to plot the graph of this equation we will need to find some of the solutions of the given equation.
To find the solutions we will substitute the values of x in the equation and find the corresponding values of y.
Let us first substitute x = 3 Hence we get y = 9.
Similarly if we substitute x = 6 we get y =14.
Now again let us substitute x = - 3 then we get y = - 1.
Now let us make a table of the values of x and corresponding values of y which satisfies the equation.
| x | y |
| 3 | 9 |
| 6 | 14 |
| -3 | -1 |
Hence we have (3, 9), (6, 14) and (-3, -1) satisfy the given equation.
Now let us plot these points on a graph and draw a line passing through all the points.
Hence we have a graph of the given equation.
Note: Now note when we substitute x = 0 the corresponding value of y is called y intercept. y intercept is the intersection of the line and y axis. Similarly if we substitute y = 0 then we get x intercept which is the intersection of line and x axis. Also choose the value of x wisely so that we get y as an integer and it is easy to plot on the graph.
Recently Updated Pages
Basicity of sulphurous acid and sulphuric acid are
Master Class 10 Computer Science: Engaging Questions & Answers for Success
Master Class 10 Social Science: Engaging Questions & Answers for Success
Master Class 10 Science: Engaging Questions & Answers for Success
Class 10 Question and Answer - Your Ultimate Solutions Guide
Master Class 10 Maths: Engaging Questions & Answers for Success
Trending doubts
What is the Total Duration of Football Match?
Explain the Treaty of Vienna of 1815 class 10 social science CBSE
In football, which nation is called "La Roja"?
Why is there a time difference of about 5 hours between class 10 social science CBSE
10 examples of evaporation in daily life with explanations
What is the full form of POSCO class 10 social science CBSE