


How do you graph the equation \[y=\dfrac{3}{4}x-5\]?
Answer
572.7k+ views
Hint: In this problem we have to graph the given equation\[y=\dfrac{3}{4}x-5\], to draw the graph, we have to find the points to be plotted. We can first find the point at y-intercept, we know that at y-intercept x is equal to 0, so we will get a point to be plotted. We can also find other points by giving different values to x and y and we can plot the graph using those points.
Complete step by step answer:
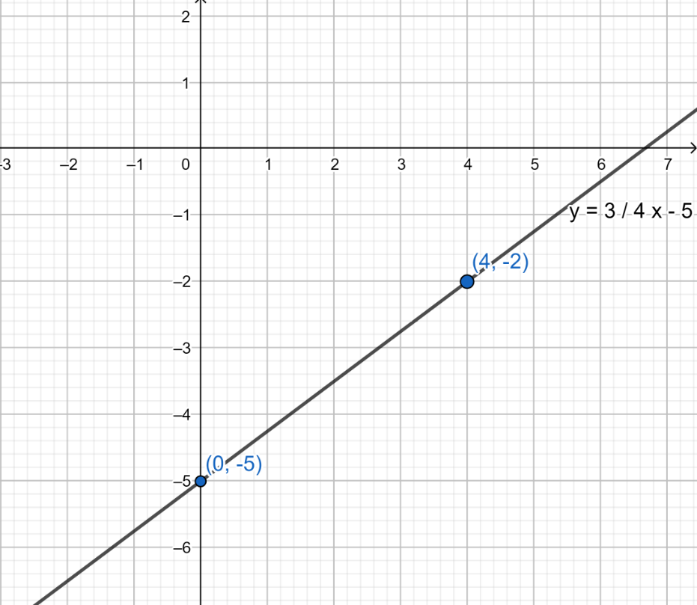
We know that the given equation is,
\[y=\dfrac{3}{4}x-5\]……. (1)
Now we can find the y-intercept.
For y-intercept, the value of x is 0, x=0,
Now we can substitute the value of x in equation (1), we get
\[\begin{align}
& \Rightarrow y=\dfrac{3}{4}\left( 0 \right)-5 \\
& \Rightarrow y=-5 \\
\end{align}\]
Here we found one of the points to be plotted in the graph, that is \[\left( 0,-5 \right)\]
Now we can find other points to be plotted in the graph.
We know that, to find other points we can give different values of x and y.
We can assume x=4, from equation (1), we get
\[\begin{align}
& \Rightarrow y=\dfrac{3}{4}\left( 4 \right)-5 \\
& \Rightarrow y=3-5 \\
& \Rightarrow y=-2 \\
\end{align}\]
Here we also got another point to be plotted in the graph, that is\[\left( 4,-2 \right)\]
Therefore, the points \[\left( 0,-5 \right)\]and \[\left( 4,-2 \right)\]can be plotted in the graph.
Note: Students make mistakes while finding the value of x and y, the points which are to be plotted in the graph. Students should know to graph the points in the correct quadrant. We should remember that at y-intercept x is equal to 0 and at x-intercept y is equal to 0.
Complete step by step answer:
We know that the given equation is,
\[y=\dfrac{3}{4}x-5\]……. (1)
Now we can find the y-intercept.
For y-intercept, the value of x is 0, x=0,
Now we can substitute the value of x in equation (1), we get
\[\begin{align}
& \Rightarrow y=\dfrac{3}{4}\left( 0 \right)-5 \\
& \Rightarrow y=-5 \\
\end{align}\]
Here we found one of the points to be plotted in the graph, that is \[\left( 0,-5 \right)\]
Now we can find other points to be plotted in the graph.
We know that, to find other points we can give different values of x and y.
We can assume x=4, from equation (1), we get
\[\begin{align}
& \Rightarrow y=\dfrac{3}{4}\left( 4 \right)-5 \\
& \Rightarrow y=3-5 \\
& \Rightarrow y=-2 \\
\end{align}\]
Here we also got another point to be plotted in the graph, that is\[\left( 4,-2 \right)\]
Therefore, the points \[\left( 0,-5 \right)\]and \[\left( 4,-2 \right)\]can be plotted in the graph.
Note: Students make mistakes while finding the value of x and y, the points which are to be plotted in the graph. Students should know to graph the points in the correct quadrant. We should remember that at y-intercept x is equal to 0 and at x-intercept y is equal to 0.
Recently Updated Pages
Basicity of sulphurous acid and sulphuric acid are
Master Class 11 Business Studies: Engaging Questions & Answers for Success
Master Class 11 Computer Science: Engaging Questions & Answers for Success
Master Class 11 Economics: Engaging Questions & Answers for Success
Master Class 12 English: Engaging Questions & Answers for Success
Master Class 12 Social Science: Engaging Questions & Answers for Success
Trending doubts
Fill the blanks with the suitable prepositions 1 The class 9 english CBSE
Difference Between Plant Cell and Animal Cell
Find the sum of series 1 + 2 + 3 + 4 + 5 + + 100 class 9 maths CBSE
Distinguish between Conventional and nonconventional class 9 social science CBSE
Find the greatest fivedigit number which is a perfect class 9 maths CBSE
Find the mode and median of the data 13 16 12 14 1-class-9-maths-CBSE