


How do you graph the equation \[y=-\dfrac{3}{4}x-1\]?
Answer
559.2k+ views
Hint: We are asked to draw the graph of the equation \[y=-\dfrac{3}{4}x-1\]. The degree of an equation is the highest power of the variable present in it. So, for this equation, the highest power present \[x\] is 1, the degree is also 1. From this, it can be said that this is a linear equation. The graph of a linear equation represents a straight line.
Complete step by step answer:
The general equation of a straight line is \[ax+by+c=0\], where \[a,b,c\] are any real numbers. The given equation is \[y=-\dfrac{3}{4}x-1\], the equation can also be written as \[\dfrac{3}{4}x+1+y=0\], comparing with the general equation of straight line, we get \[a=\dfrac{3}{4},b=1\And c=1\].
To plot the graph of an equation of the straight line, we should know at least two points, through which the line passes.
To make things simple, let’s take the X-intercept and Y-intercept as the two points. X-intercept is the point where the line crosses X-axis, this means that the Y-coordinate will be \[0\], similarly, Y-intercept is the point where the line crosses Y-axis, so X-coordinate will be \[0\]. We will use this property now.
We substitute \[y=0\] in the equation \[\dfrac{3}{4}x+1+y=0\], we get
\[\begin{align}
& \Rightarrow \dfrac{3}{4}x+1+0=0 \\
& \Rightarrow \dfrac{3}{4}x+1=0 \\
\end{align}\]
Subtracting 1 from both sides of equation we get,
\[\begin{align}
& \Rightarrow \dfrac{3}{4}x+1-1=0-1 \\
& \Rightarrow \dfrac{3}{4}x=-1 \\
\end{align}\]
We multiply \[\dfrac{4}{3}\] to both sides we get,
\[\begin{align}
& \Rightarrow \left( \dfrac{3}{4}x \right)\times \dfrac{4}{3}=\left( -1 \right)\times \dfrac{4}{3} \\
& \therefore x=\dfrac{-4}{3} \\
\end{align}\]
So, the coordinates of the X-intercept are \[\left( \dfrac{-4}{3},0 \right)\].
Similarly, now we substitute \[x=0\] in the equation \[5x-y-5=0\], we get
\[\Rightarrow \dfrac{3}{4}\left( 0 \right)+1+y=0\]
Adding \[-1\] to both sides of the equation, we get
\[\begin{align}
& \Rightarrow 1+y-1=0-1 \\
& \therefore y=-1 \\
\end{align}\]
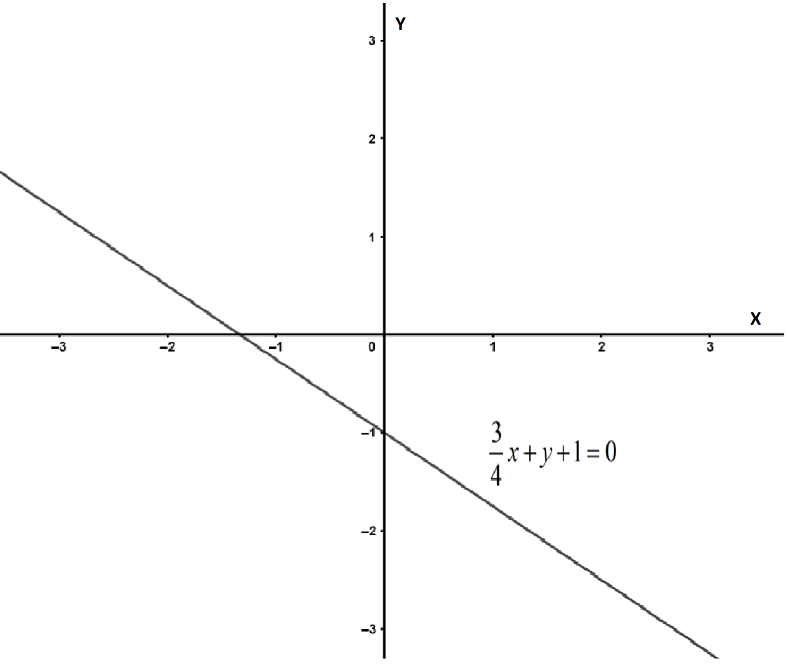
So, the coordinates of the Y-intercept are\[\left( 0,-1 \right)\].
Using these two points we can plot the graph of the equation as follows:
Note:
Here, we found the two points which are X-intercept and Y-intercept by substituting either-or \[y\], one at a time. We can also find these values by converting the straight-line equation to the equation in intercept form which is, \[\dfrac{x}{a}+\dfrac{y}{b}=1\]. Here, \[a\And b\]are X-intercept and Y-intercept respectively.
Complete step by step answer:
The general equation of a straight line is \[ax+by+c=0\], where \[a,b,c\] are any real numbers. The given equation is \[y=-\dfrac{3}{4}x-1\], the equation can also be written as \[\dfrac{3}{4}x+1+y=0\], comparing with the general equation of straight line, we get \[a=\dfrac{3}{4},b=1\And c=1\].
To plot the graph of an equation of the straight line, we should know at least two points, through which the line passes.
To make things simple, let’s take the X-intercept and Y-intercept as the two points. X-intercept is the point where the line crosses X-axis, this means that the Y-coordinate will be \[0\], similarly, Y-intercept is the point where the line crosses Y-axis, so X-coordinate will be \[0\]. We will use this property now.
We substitute \[y=0\] in the equation \[\dfrac{3}{4}x+1+y=0\], we get
\[\begin{align}
& \Rightarrow \dfrac{3}{4}x+1+0=0 \\
& \Rightarrow \dfrac{3}{4}x+1=0 \\
\end{align}\]
Subtracting 1 from both sides of equation we get,
\[\begin{align}
& \Rightarrow \dfrac{3}{4}x+1-1=0-1 \\
& \Rightarrow \dfrac{3}{4}x=-1 \\
\end{align}\]
We multiply \[\dfrac{4}{3}\] to both sides we get,
\[\begin{align}
& \Rightarrow \left( \dfrac{3}{4}x \right)\times \dfrac{4}{3}=\left( -1 \right)\times \dfrac{4}{3} \\
& \therefore x=\dfrac{-4}{3} \\
\end{align}\]
So, the coordinates of the X-intercept are \[\left( \dfrac{-4}{3},0 \right)\].
Similarly, now we substitute \[x=0\] in the equation \[5x-y-5=0\], we get
\[\Rightarrow \dfrac{3}{4}\left( 0 \right)+1+y=0\]
Adding \[-1\] to both sides of the equation, we get
\[\begin{align}
& \Rightarrow 1+y-1=0-1 \\
& \therefore y=-1 \\
\end{align}\]
So, the coordinates of the Y-intercept are\[\left( 0,-1 \right)\].
Using these two points we can plot the graph of the equation as follows:
Note:
Here, we found the two points which are X-intercept and Y-intercept by substituting either-or \[y\], one at a time. We can also find these values by converting the straight-line equation to the equation in intercept form which is, \[\dfrac{x}{a}+\dfrac{y}{b}=1\]. Here, \[a\And b\]are X-intercept and Y-intercept respectively.
Recently Updated Pages
Master Class 11 Computer Science: Engaging Questions & Answers for Success
Master Class 11 Business Studies: Engaging Questions & Answers for Success
Master Class 11 Economics: Engaging Questions & Answers for Success
Master Class 11 English: Engaging Questions & Answers for Success
Master Class 11 Maths: Engaging Questions & Answers for Success
Master Class 11 Biology: Engaging Questions & Answers for Success
Trending doubts
One Metric ton is equal to kg A 10000 B 1000 C 100 class 11 physics CBSE
There are 720 permutations of the digits 1 2 3 4 5 class 11 maths CBSE
Discuss the various forms of bacteria class 11 biology CBSE
Draw a diagram of a plant cell and label at least eight class 11 biology CBSE
State the laws of reflection of light
Explain zero factorial class 11 maths CBSE