


How do you graph the equation $y=\dfrac{1}{5}x$ by plotting points?
Answer
600.9k+ views
Hint: We start solving the problem by recalling the fact that we need at least two points to draw a line. We then find one of the points on the given line by using the fact that the line of the form $y=mx$ passes through the origin $\left( 0,0 \right)$. We then find another point on the given line by assuming the x-coordinate of the point and then finding the required y-coordinate of that point. We then represent these two points on the plot and then join those points to get the required plot.
Complete step by step answer:
According to the problem, we are asked to plot the given equation $y=\dfrac{1}{5}x$ by using the points.
We can see that the given equation $y=\dfrac{1}{5}x$ resembles the slope form of the equation of the line $y=mx$.
We know that in order to draw a line, we at least need two points. So, let us find two points by assuming the values of x.
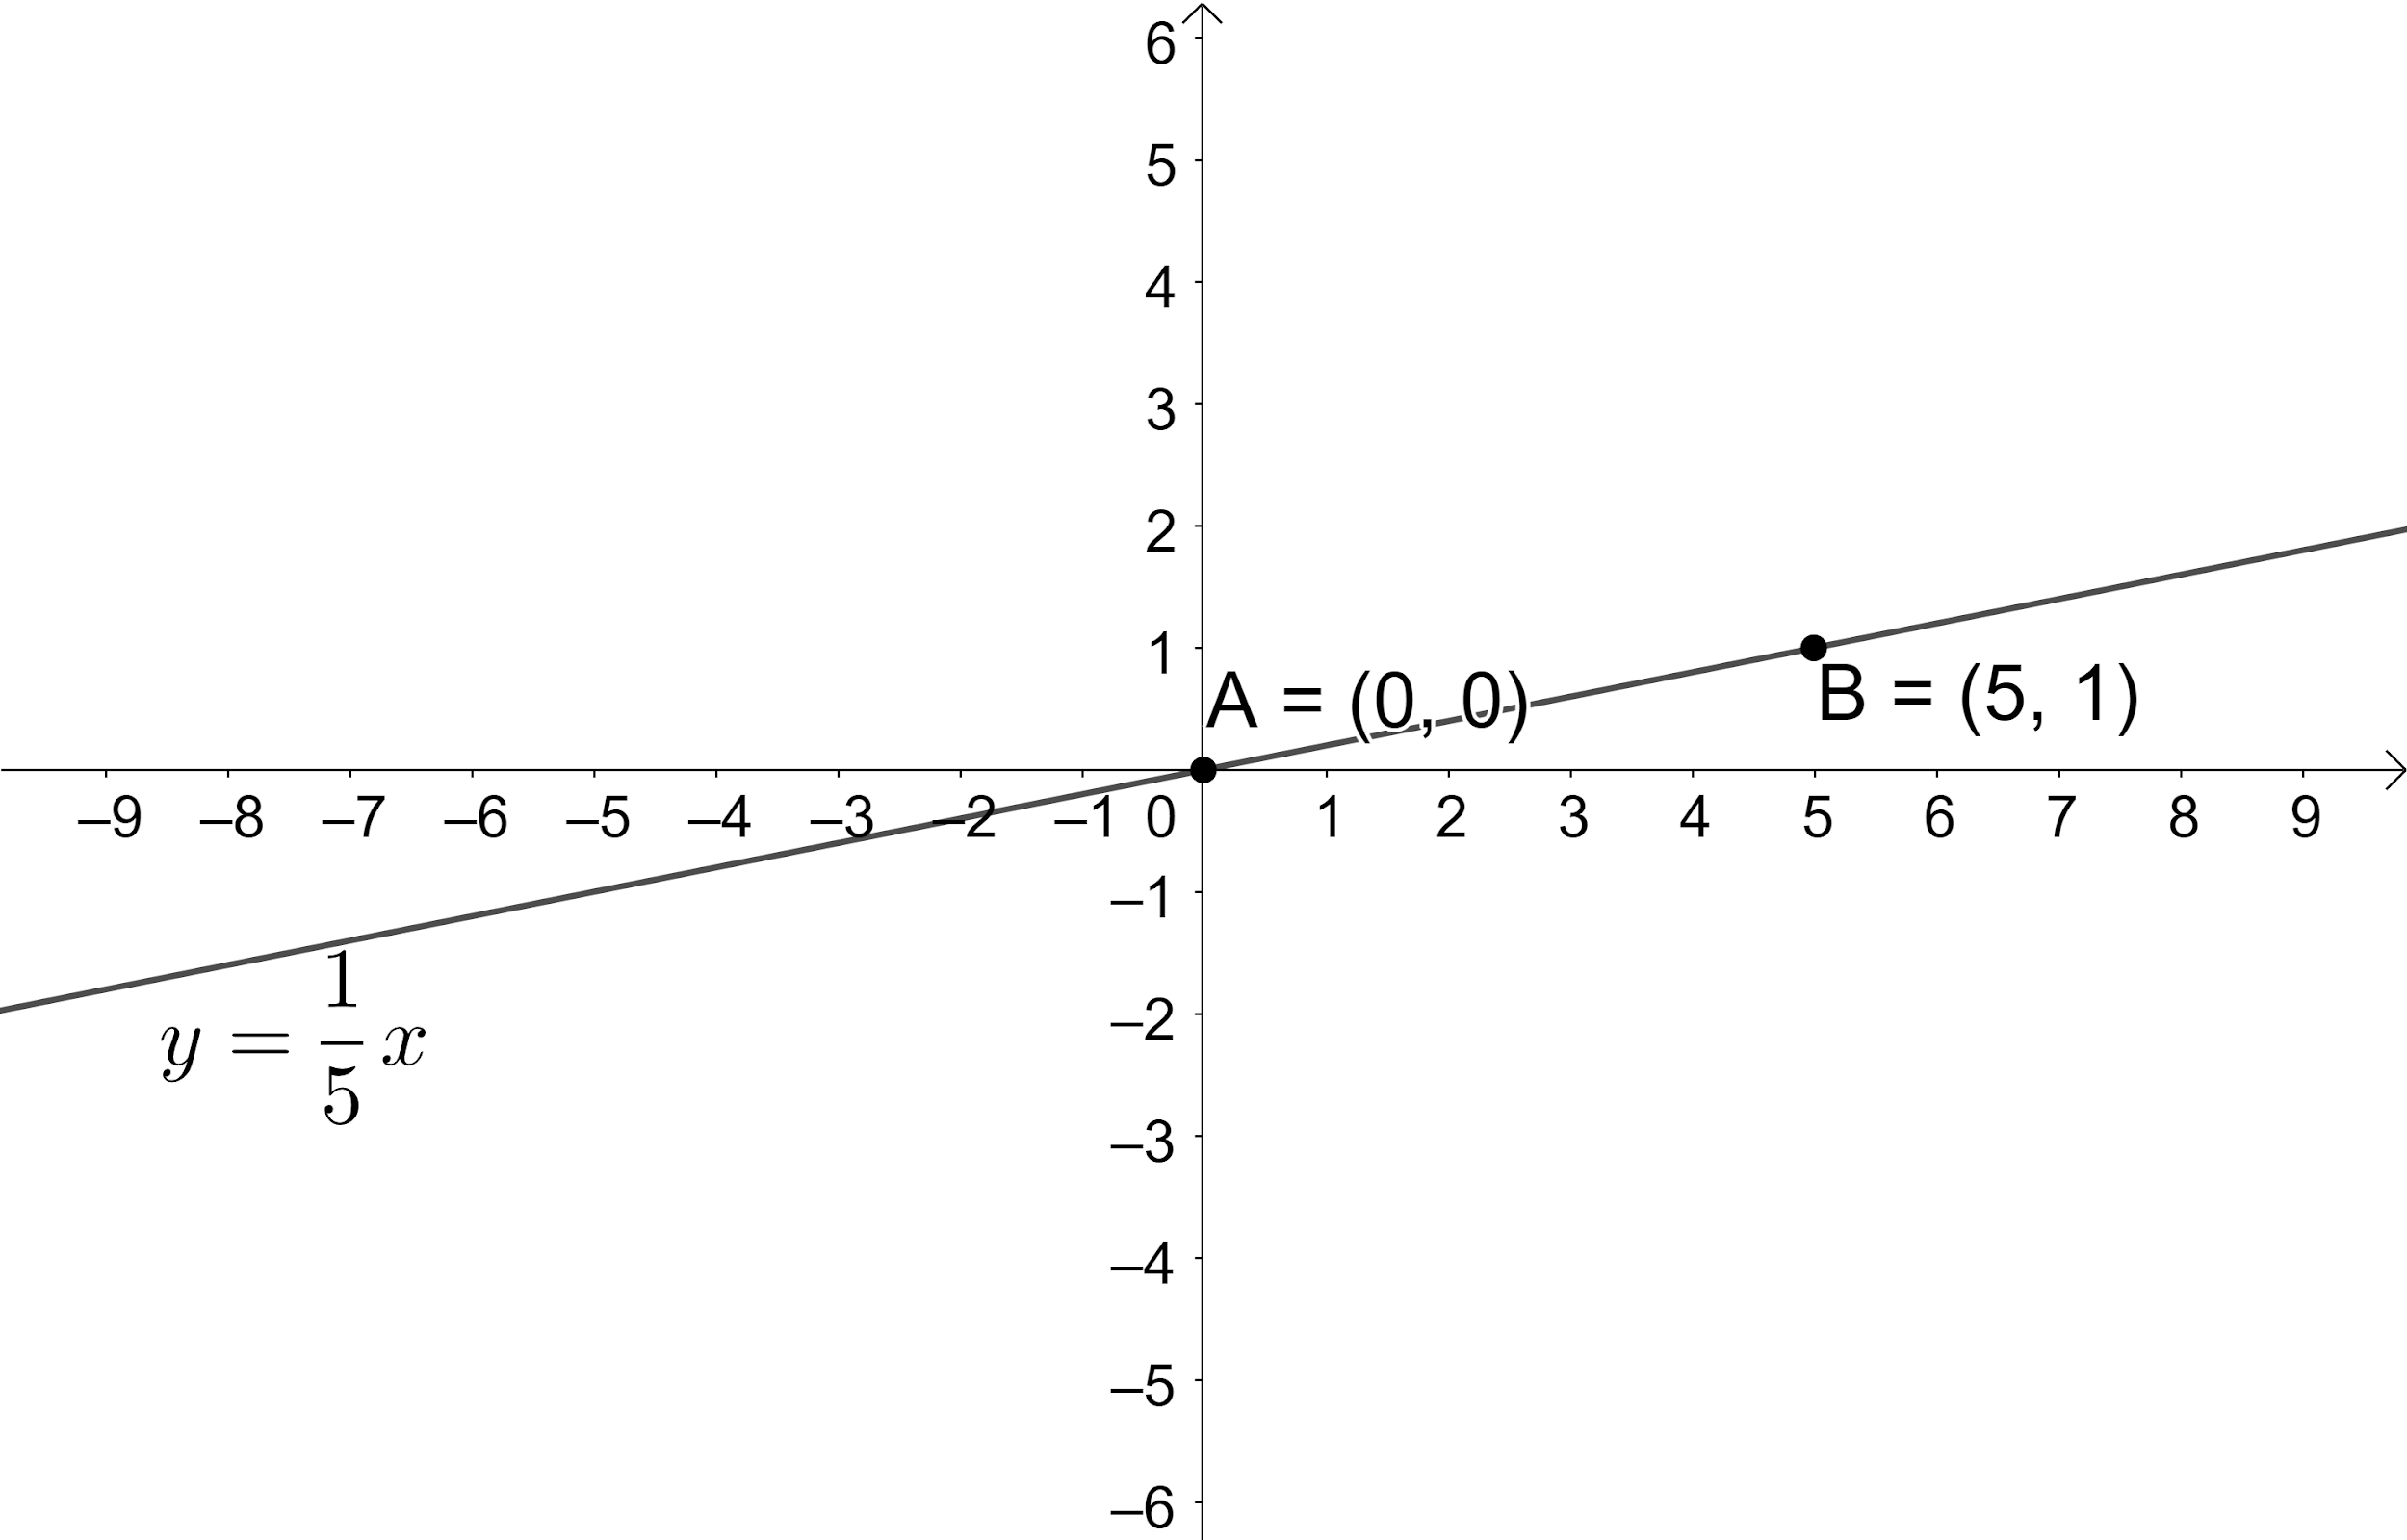
We know that the line of the form $y=mx$ passes through the origin $\left( 0,0 \right)$. So, the given line $y=\dfrac{1}{5}x$ passes through the point $A\left( 0,0 \right)$.
Now, let us find the point at which the x-coordinate of the point on the given line is equal to 5. Let us substitute $x=5$ in the given equation to find the y-coordinate of the point on the given line.
So, we get $y=\dfrac{1}{5}\left( 5 \right)$.
$\Rightarrow y=1$.
So, the point on the line $y=\dfrac{1}{5}x$ with x-coordinate as 5 is $B\left( 5,1 \right)$.
Now, let us plot the given line by representing and joining the obtained two points on the graph which is as shown below:
Note:
Whenever we get this type of problem, we first try to find the points by assuming the values for x to find the points which will help to plot on the graph. Whenever we get this type of problem, we first try to find the figure that the given equation represents to avoid confusion. Similarly, we can expect problems to plot the function $y=7x+14$ on the graph.
Complete step by step answer:
According to the problem, we are asked to plot the given equation $y=\dfrac{1}{5}x$ by using the points.
We can see that the given equation $y=\dfrac{1}{5}x$ resembles the slope form of the equation of the line $y=mx$.
We know that in order to draw a line, we at least need two points. So, let us find two points by assuming the values of x.
We know that the line of the form $y=mx$ passes through the origin $\left( 0,0 \right)$. So, the given line $y=\dfrac{1}{5}x$ passes through the point $A\left( 0,0 \right)$.
Now, let us find the point at which the x-coordinate of the point on the given line is equal to 5. Let us substitute $x=5$ in the given equation to find the y-coordinate of the point on the given line.
So, we get $y=\dfrac{1}{5}\left( 5 \right)$.
$\Rightarrow y=1$.
So, the point on the line $y=\dfrac{1}{5}x$ with x-coordinate as 5 is $B\left( 5,1 \right)$.
Now, let us plot the given line by representing and joining the obtained two points on the graph which is as shown below:
Note:
Whenever we get this type of problem, we first try to find the points by assuming the values for x to find the points which will help to plot on the graph. Whenever we get this type of problem, we first try to find the figure that the given equation represents to avoid confusion. Similarly, we can expect problems to plot the function $y=7x+14$ on the graph.
Recently Updated Pages
Master Class 11 English: Engaging Questions & Answers for Success
Master Class 11 Social Science: Engaging Questions & Answers for Success
Master Class 11 Maths: Engaging Questions & Answers for Success
Master Class 11 Biology: Engaging Questions & Answers for Success
Master Class 11 Physics: Engaging Questions & Answers for Success
Master Class 11 Chemistry: Engaging Questions & Answers for Success