


How do you graph the equation $y=-\dfrac{1}{5}x+2$ ?
Answer
573k+ views
Hint: First of all, put the x coordinate of this line as 0 and then see what value of y coordinate you are getting and plot that point on the graph paper. After that, put y coordinate as 0 in the given straight line and then see what is the x coordinate corresponding to this y coordinate and then plot this coordinate on the graph paper. Now, join these two points. Joining these two points will give you a straight line.
Complete step by step answer:
The equation of a straight line given in the above problem is as follows:
$y=-\dfrac{1}{5}x+2$………… Eq. (1)
We are asked to draw the above straight line on the graph paper. For that, we are going to substitute x coordinate as 0 in the above straight line and then solve the remaining equation to get the y coordinate.
$\begin{align}
& y=-\dfrac{1}{5}\left( 0 \right)+2 \\
& \Rightarrow y=0+2 \\
& \Rightarrow y=2 \\
\end{align}$
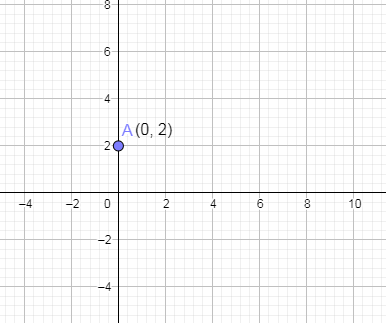
From the above we got the one point i.e. $\left( 0,2 \right)$. Let us name this point as A. Now, we are going to plot this point A (0,2) on the graph paper.
Now, we are going to put the y coordinate as 0 in eq. (1) and solve the remaining equation to get the value of x.
$0=-\dfrac{1}{5}x+2$
Subtracting 2 on both the sides we get,
$\begin{align}
& 0-2=-\dfrac{1}{5}x+2-2 \\
& \Rightarrow -2=-\dfrac{1}{5}x \\
\end{align}$
Negative signs from both the sides will be cancelled out and then we cross multiply the above equation.
$\begin{align}
& \Rightarrow 2\left( 5 \right)=x \\
& \Rightarrow 10=x \\
\end{align}$
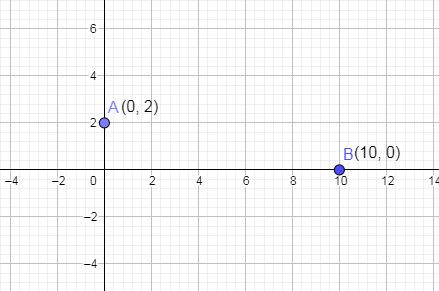
From the above, we got the second coordinate as $\left( 10,0 \right)$. Now, let us name this point as B and plot this point B on the graph paper.
Now, we are going to join the points A and B to draw a straight line.
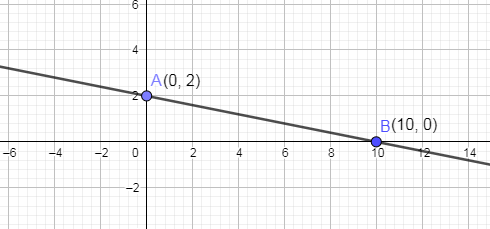
Hence, we have plotted the straight line $y=-\dfrac{1}{5}x+2$ on the graph paper.
Note: You can check that the graph that you have plotted is correct or not. Let us mark the x coordinate as 5 on the straight line and then draw a perpendicular on the y axis from this point and see the point on the y axis on which the foot of the perpendicular is lying.
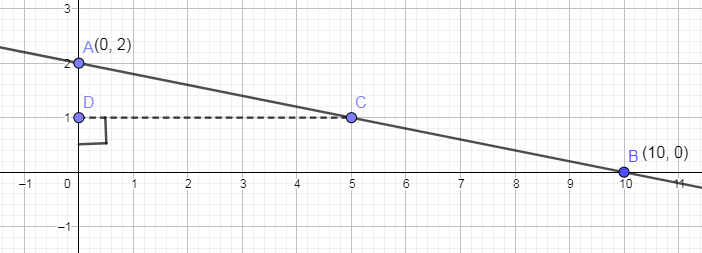
In the above graph C is the point where x coordinate is 5 and the foot of the perpendicular from C is D and coordinate of y of point D is 1.
Now, let us substitute x as 5 in eq. (1) and see the value of y from the equation.
$\begin{align}
& y=-\dfrac{1}{5}\left( 5 \right)+2 \\
& \Rightarrow y=-1+2 \\
& \Rightarrow y=1 \\
\end{align}$
As you can see that we are getting the same value of y coordinate that we were getting from the graph so this shows that the graph which we have plotted is correct.
Complete step by step answer:
The equation of a straight line given in the above problem is as follows:
$y=-\dfrac{1}{5}x+2$………… Eq. (1)
We are asked to draw the above straight line on the graph paper. For that, we are going to substitute x coordinate as 0 in the above straight line and then solve the remaining equation to get the y coordinate.
$\begin{align}
& y=-\dfrac{1}{5}\left( 0 \right)+2 \\
& \Rightarrow y=0+2 \\
& \Rightarrow y=2 \\
\end{align}$
From the above we got the one point i.e. $\left( 0,2 \right)$. Let us name this point as A. Now, we are going to plot this point A (0,2) on the graph paper.
Now, we are going to put the y coordinate as 0 in eq. (1) and solve the remaining equation to get the value of x.
$0=-\dfrac{1}{5}x+2$
Subtracting 2 on both the sides we get,
$\begin{align}
& 0-2=-\dfrac{1}{5}x+2-2 \\
& \Rightarrow -2=-\dfrac{1}{5}x \\
\end{align}$
Negative signs from both the sides will be cancelled out and then we cross multiply the above equation.
$\begin{align}
& \Rightarrow 2\left( 5 \right)=x \\
& \Rightarrow 10=x \\
\end{align}$
From the above, we got the second coordinate as $\left( 10,0 \right)$. Now, let us name this point as B and plot this point B on the graph paper.
Now, we are going to join the points A and B to draw a straight line.
Hence, we have plotted the straight line $y=-\dfrac{1}{5}x+2$ on the graph paper.
Note: You can check that the graph that you have plotted is correct or not. Let us mark the x coordinate as 5 on the straight line and then draw a perpendicular on the y axis from this point and see the point on the y axis on which the foot of the perpendicular is lying.
In the above graph C is the point where x coordinate is 5 and the foot of the perpendicular from C is D and coordinate of y of point D is 1.
Now, let us substitute x as 5 in eq. (1) and see the value of y from the equation.
$\begin{align}
& y=-\dfrac{1}{5}\left( 5 \right)+2 \\
& \Rightarrow y=-1+2 \\
& \Rightarrow y=1 \\
\end{align}$
As you can see that we are getting the same value of y coordinate that we were getting from the graph so this shows that the graph which we have plotted is correct.

Recently Updated Pages
Basicity of sulphurous acid and sulphuric acid are
Master Class 11 Business Studies: Engaging Questions & Answers for Success
Master Class 11 Computer Science: Engaging Questions & Answers for Success
Master Class 11 Economics: Engaging Questions & Answers for Success
Master Class 12 English: Engaging Questions & Answers for Success
Master Class 12 Social Science: Engaging Questions & Answers for Success
Trending doubts
Fill the blanks with the suitable prepositions 1 The class 9 english CBSE
Difference Between Plant Cell and Animal Cell
Find the sum of series 1 + 2 + 3 + 4 + 5 + + 100 class 9 maths CBSE
Distinguish between Conventional and nonconventional class 9 social science CBSE
Find the mode and median of the data 13 16 12 14 1-class-9-maths-CBSE
What is pollution? How many types of pollution? Define it