


How do you graph the equation \[y = \dfrac{2}{3}x - 2\] ?
Answer
533.1k+ views
Hint: Here in this question, we have to plot the graph, where the equation for the graph is given in the question. Substituting the known values to the equation we can find the value unknown of the equation. Hence, we can plot the graph by using the values.
Complete step by step solution:
The equation of a graph is given as \[y = \dfrac{2}{3}x - 2\] . we will substitute the value of x as randomly and we are going to find the value of y. The coefficient of x is in the form of fraction, the denominator value is 3. Let the values of x be -9, -6, -3, 0, 3, 6, 9
Now we consider the value of x and we substitute in the equation of graph \[y = \dfrac{2}{3}x - 2\] , hence we can find the value of y
Consider the equation of graph \[y = \dfrac{2}{3}x - 2\] ------ (1)
Substitute the value of x as -9 in equation (1). So we have
\[
\Rightarrow y = \dfrac{2}{3}( - 9) - 2 \\
\Rightarrow y = - 6 - 2 \\
\Rightarrow y = - 8 \;
\]
When x is -9 the value of y is -8
Substitute the value of x as -6 in equation (1). So we have
\[
\Rightarrow y = \dfrac{2}{3}( - 6) - 2 \\
\Rightarrow y = - 4 - 2 \\
\Rightarrow y = - 6 \;
\]
When x is -6 the value of y is -6
Substitute the value of x as -3 in equation (1). So we have
\[
\Rightarrow y = \dfrac{2}{3}( - 3) - 2 \\
\Rightarrow y = - 2 - 2 \\
\Rightarrow y = - 4 \;
\]
When x is -3 the value of y is -4
Substitute the value of x as 0 in equation (1). So we have
\[
\Rightarrow y = \dfrac{2}{3}(0) - 2 \\
\Rightarrow y = 0 - 2 \\
\Rightarrow y = - 2 \;
\]
When x is 0 the value of y is -2
Substitute the value of x as 3 in equation (1). So we have
\[
\Rightarrow y = \dfrac{2}{3}(3) - 2 \\
\Rightarrow y = 2 - 2 \\
\Rightarrow y = 0 \;
\]
When x is 3 the value of y is 0
Substitute the value of x as 6 in equation (1). So we have
\[
\Rightarrow y = \dfrac{2}{3}(6) - 2 \\
\Rightarrow y = 4 - 2 \\
\Rightarrow y = 2 \;
\]
When x is 6 the value of y is 2
Substitute the value of x as 9 in equation (1). So we have
\[
\Rightarrow y = \dfrac{2}{3}(9) - 2 \\
\Rightarrow y = 6 - 2 \\
\Rightarrow y = 4 \;
\]
When x is 9 the value of y is-4
Therefore, we have table as
Considering these points we can plot the graph. The graph is shown below.
Note: The question is belonging to the concept of graph. By comparing the given equation to the equation of a line we calculate the slope and intercept. Or by choosing the value of x we can determine the value of y and then plotting the graphs for these points we obtain the result.
Complete step by step solution:
The equation of a graph is given as \[y = \dfrac{2}{3}x - 2\] . we will substitute the value of x as randomly and we are going to find the value of y. The coefficient of x is in the form of fraction, the denominator value is 3. Let the values of x be -9, -6, -3, 0, 3, 6, 9
Now we consider the value of x and we substitute in the equation of graph \[y = \dfrac{2}{3}x - 2\] , hence we can find the value of y
Consider the equation of graph \[y = \dfrac{2}{3}x - 2\] ------ (1)
Substitute the value of x as -9 in equation (1). So we have
\[
\Rightarrow y = \dfrac{2}{3}( - 9) - 2 \\
\Rightarrow y = - 6 - 2 \\
\Rightarrow y = - 8 \;
\]
When x is -9 the value of y is -8
Substitute the value of x as -6 in equation (1). So we have
\[
\Rightarrow y = \dfrac{2}{3}( - 6) - 2 \\
\Rightarrow y = - 4 - 2 \\
\Rightarrow y = - 6 \;
\]
When x is -6 the value of y is -6
Substitute the value of x as -3 in equation (1). So we have
\[
\Rightarrow y = \dfrac{2}{3}( - 3) - 2 \\
\Rightarrow y = - 2 - 2 \\
\Rightarrow y = - 4 \;
\]
When x is -3 the value of y is -4
Substitute the value of x as 0 in equation (1). So we have
\[
\Rightarrow y = \dfrac{2}{3}(0) - 2 \\
\Rightarrow y = 0 - 2 \\
\Rightarrow y = - 2 \;
\]
When x is 0 the value of y is -2
Substitute the value of x as 3 in equation (1). So we have
\[
\Rightarrow y = \dfrac{2}{3}(3) - 2 \\
\Rightarrow y = 2 - 2 \\
\Rightarrow y = 0 \;
\]
When x is 3 the value of y is 0
Substitute the value of x as 6 in equation (1). So we have
\[
\Rightarrow y = \dfrac{2}{3}(6) - 2 \\
\Rightarrow y = 4 - 2 \\
\Rightarrow y = 2 \;
\]
When x is 6 the value of y is 2
Substitute the value of x as 9 in equation (1). So we have
\[
\Rightarrow y = \dfrac{2}{3}(9) - 2 \\
\Rightarrow y = 6 - 2 \\
\Rightarrow y = 4 \;
\]
When x is 9 the value of y is-4
Therefore, we have table as
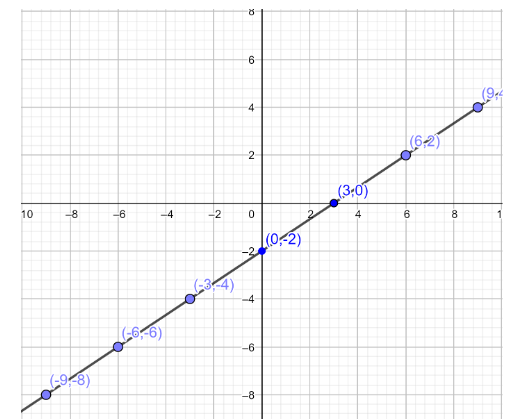
| x | -9 | -6 | -3 | 0 | 3 | 6 | 9 |
| y | -8 | -6 | -4 | -2 | 0 | 2 | 4 |
Considering these points we can plot the graph. The graph is shown below.
Note: The question is belonging to the concept of graph. By comparing the given equation to the equation of a line we calculate the slope and intercept. Or by choosing the value of x we can determine the value of y and then plotting the graphs for these points we obtain the result.
Recently Updated Pages
Master Class 8 Social Science: Engaging Questions & Answers for Success
Master Class 8 English: Engaging Questions & Answers for Success
Class 8 Question and Answer - Your Ultimate Solutions Guide
Master Class 8 Maths: Engaging Questions & Answers for Success
Master Class 8 Science: Engaging Questions & Answers for Success
Master Class 9 General Knowledge: Engaging Questions & Answers for Success
Trending doubts
What is BLO What is the full form of BLO class 8 social science CBSE
Citizens of India can vote at the age of A 18 years class 8 social science CBSE
Full form of STD, ISD and PCO
Advantages and disadvantages of science
Right to vote is a AFundamental Right BFundamental class 8 social science CBSE
What are the 12 elements of nature class 8 chemistry CBSE